By Sarah Buchhorn
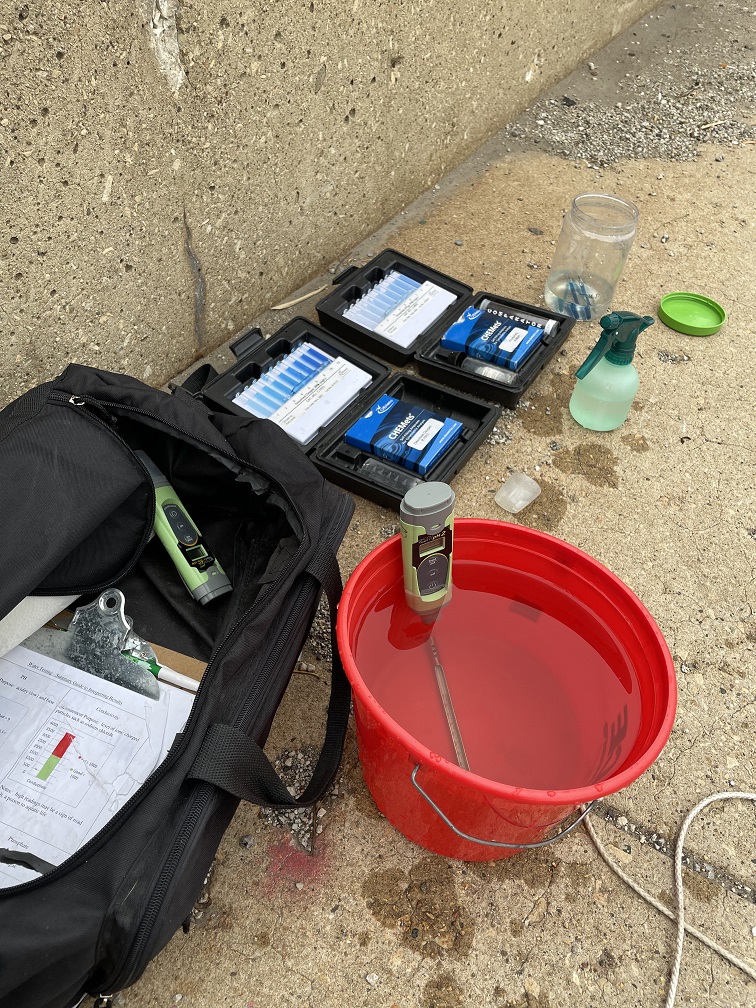
As with other aspects of the Water Sampling Program, the Chicago Group Water Team’s approach to collecting, maintaining, and sharing water quality data evolved over time. When I became involved with the water team in 2018, samplers would record sampling results with pencil and paper and then transfer them to a Google Sheet. Every other year, we shared the data with the Illinois Environmental Protection Agency (IEPA), and occasionally Water Team members created summary graphs and analyses to share with other audiences.
This worked fine, but I saw an opportunity to improve the process and visuals.
I put the finishing touches on work already underway to use a Google Form to record data. The form responses and manual responses are stored together in a Google Sheet. I added in a few simple field validation procedures (e.g., no negative values allowed for certain parameters, "Site Sampled" must be a choice from the dropdown list, etc.), as well as lookup tables and formulas to make filling in latitude, longitude, and Celsius conversions easier. Using the form and these validation checks improves data standardization and helps us keep timely results. While humans can easily understand that "Kedzie Near 31st" and "Kedzie/31st" are the same thing, having consistent site names makes automated analyses and data processes simpler.
Some samplers prefer using the form, while others still prefer to record on paper and transfer to the spreadsheet later. It is a welcome change to not have to remember to transfer over the data later, but I can attest that sampling during the bitterly cold winter months makes recording data with your phone difficult!
The next and most impactful endeavor was the creation of the Chicago River Checkup website. Water sampling team members are always thinking of ways to achieve our goal of educating people about the region’s waterways, and we agreed that this was a helpful way to visualize our results. While I am comfortable with coding and data manipulation, I had very limited experience with web development. Fortunately, I was able to create the website with the help of a mentor through the Chicago Python User Group (ChiPy)’s Mentorship Program. Over the course of several months the product slowly took shape, and became a working website. You can take a look at the code and learn more about the process here.
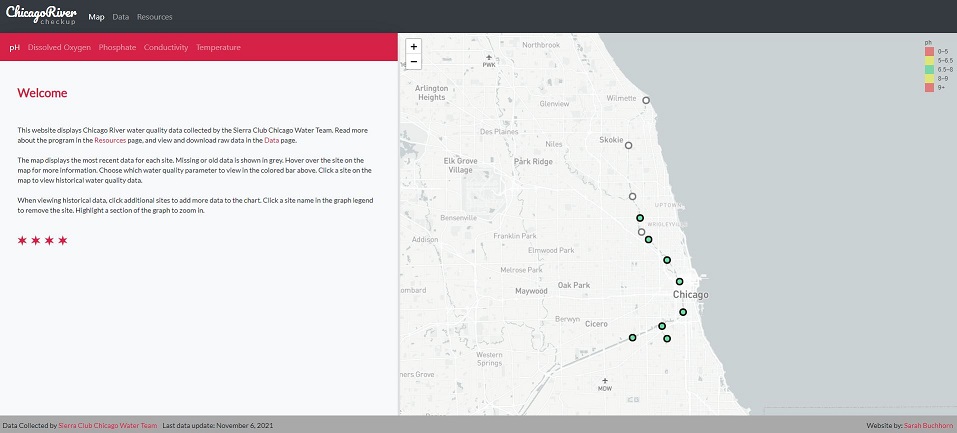
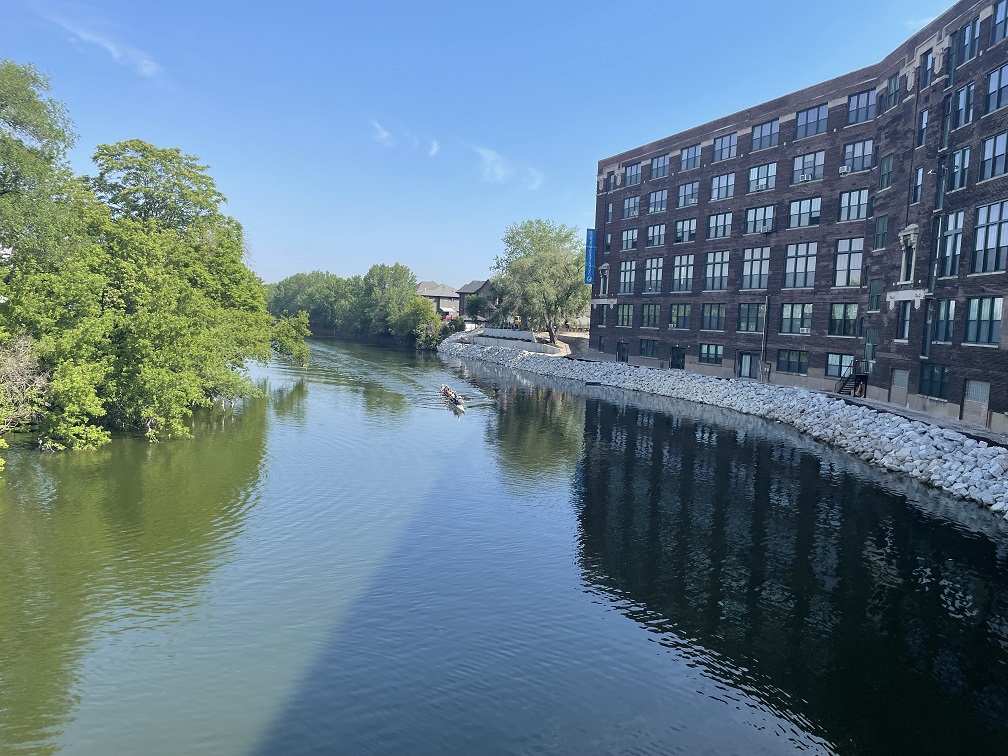
I see the website as a helpful fill-in between our annual data summaries. It allows folks to quickly scan across the most recent data we collected to see how the river is doing. Previously when I took samples and recorded data, it was hard to contextualize the results. Is this normal? Is this similar to other sites? How does one site vary from March to September? The website makes it easy to answer basic comparison questions such as these, and hopefully serves as a jumping off point for deeper analyses. Plus, some members get questions from passersby while testing, and it is easier to share a website link than email a spreadsheet.
As you’ve probably noticed, there is still room to grow and improve in our data collection, storage, and display—from ensuring each site is sampled at each sampling date to working on the mobile version of the website and improving the website update workflow. We’re always looking for new members who are passionate about working to protect Chicago’s natural resources, so learn more here if you’d like to get involved!