How a Blind Oceanographer Studies Temperature-Regulating Currents
Amy Bower and the Accessible Oceans project can turn data into sound
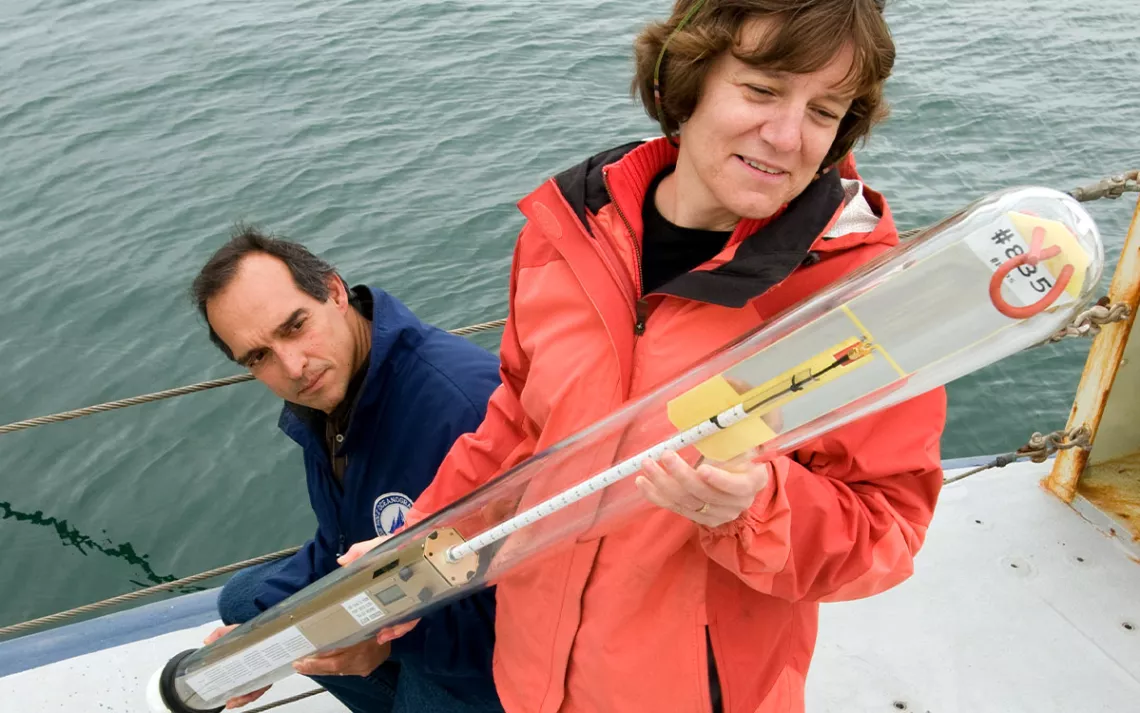
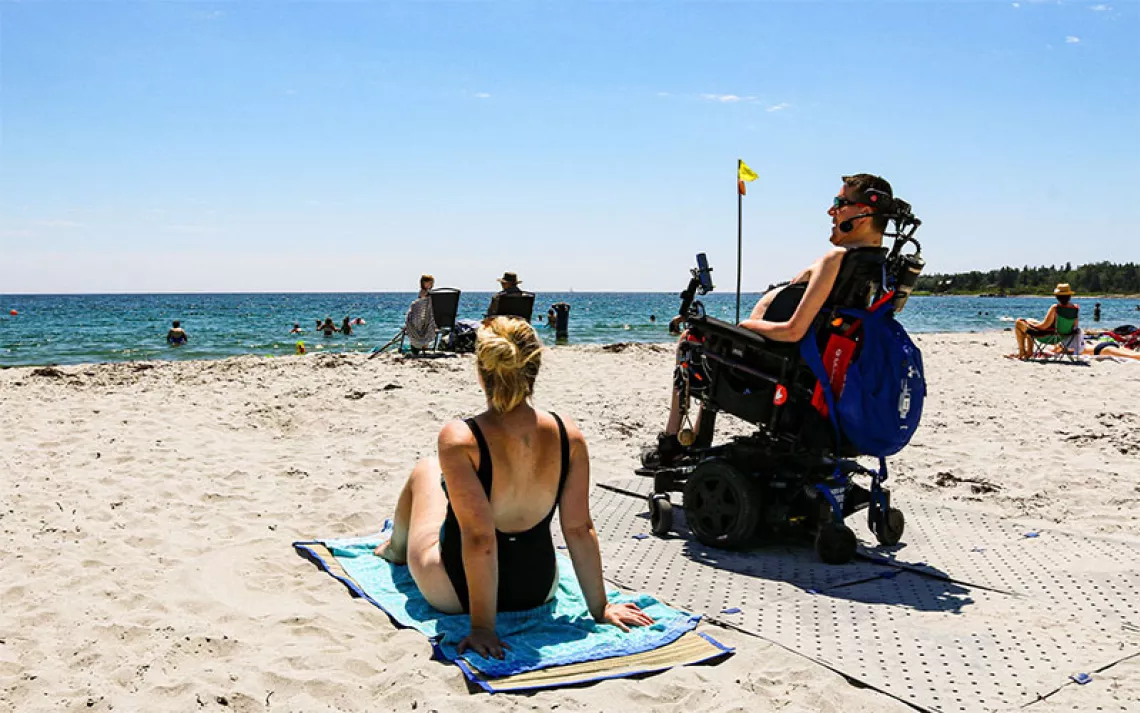
Physical oceanographer Amy Bower, right, and operations leader David Fisichella display an instrument for measuring the depth and temperature of the ocean. Bower and her colleagues use the data these floats send back to better understand the ocean circulation in the North Atlantic. | Photo by Tom Kleindinst, Woods Hole Oceanographic Institution
Up on deck, black smoke was spewing from the stack of oceanographer Amy Bower’s research vessel, but she didn’t know that. She was locked in her stateroom below. The plume of smoke came from an engine in overdrive; the vessel was lurching at top speed across the Gulf of Aden, off the coast of Yemen, with grenade-launching pirates in pursuit. The crew, Bower, and her team of scientists had drilled for this, but now it was actually happening.
Before long, the pirates gave up the chase. The scientists, rattled, revised the mission. They continued to collect data while staying at least 50 miles from the coasts of Yemen and Somalia. That trip, in 2001, might have been Bower’s most dramatic, but for the longtime oceanographer, every research cruise is an adventure.
Bower studies large-scale ocean currents and smaller ocean features called eddies, often deploying drifting subsurface buoys to collect data. Her work lately has taken her to the North Atlantic, where the days stretch long in summers, but Bower’s research cruises have grown increasingly dark.
Forty-one years ago, at 23, she was diagnosed with retinitis pigmentosa, a degenerative retinal disease. At the time, she was just a few years into her doctorate, and she was going blind. “It was devastating,” she says. “I didn’t know a single blind person, much less a blind scientist, and I thought, ‘Oh my God, can you do this?’”
Bower, now 64 and a senior scientist at Woods Hole Oceanographic Institution, has proved that you can. Her recent research has focused on thermohaline currents in the far North Atlantic, an important part of the great ocean conveyor belt, which helps regulate the ocean’s—and the Earth’s—temperature. In 2018, Bower set out from Iceland on a research cruise to collect data east of Greenland. As chief scientist, she coordinates with the captain and oversees the data collection on board.
Soon after her diagnosis, an ophthalmologist suggested she abandon research and pursue science administration instead. “I decided to ignore that advice,” Bower says now, recalling the early prognosis.
Over the ensuing decades, she has been fortunate on two fronts. Her vision loss was gradual, which gave her time to strategize how to best do her job, and she found Gerald Friedman, an optometrist in Boston with an infectious can-do spirit. He introduced her to a video magnifying device that let her put printed material under a camera to magnify it in high contrast. As her vision loss progressed and magnified text was no longer enough, Bower learned to use screen readers, assistive software programs that render text and images in speech.
This technology is vital. As a physical oceanographer, Bower primarily works on the computer. She doesn’t use, say, test tubes or microscopes, the way a chemist or biologist would. Screen readers don’t work well for graphic data plots, so she also depends on sighted assistants to describe complex charts and graphs.
Several years ago, Bower encountered a nascent technology that could upend the way vision-impaired people interact with statistics. Data sonification converts strings of numbers to sound. If you measure the temperature of a harbor over time, Bower explains, you can map your values to frequencies—for example, high values become high frequencies—and listen to how the temperature fluctuates. She imitates how it might sound, a rising and falling reminiscent of whale song. A colleague calls it Bower’s “data karaoke.”
While it’s great for representing values over time, it’s less well suited to other complex spatial visualizations that Bower may work with, such as topographical maps of the ocean floor. Sonification, as with screen readers, is not a catchall accessibility tool, but it holds enough value that Bower and a cross-disciplinary team of scientists are experimenting with how to harness the sound of data for public outreach. Bower is the principal investigator for Accessible Oceans, a National Science Foundation–funded pilot study that designs inclusive auditory displays to promote the understanding of ocean data in such places as museums and aquariums.
For one display, the team explored the daily vertical migration of zooplankton off the Oregon coast in nine audio tracks, and it takes about eight minutes to listen to the whole thing. (You can listen here.) “Let’s explore with our ears,” the narrator says.
The project aims to promote data literacy for everyone—not just for those with sensory limitations. For the general public, scientific findings can seem to come down from on high, and data sonification offers another path toward understanding: The displays invite the public to look at the world a different way—by not looking at all.
Jessica Roberts, a coinvestigator on the Accessible Oceans project, was afraid she’d have to rein in the project’s oceanographers when they developed long scripts for the audio displays. Roberts, a Georgia Tech–based learning scientist who researches how the design of interactive technologies can facilitate learning, was unsure that potential museumgoers would want to sit and listen to long displays. She was surprised when the team tested the display prototypes with blind and low-vision students and adults, and, “as it turned out, people do want to sit there for [about] 10 minutes and listen,” she says.
Bower also encourages young blind people to pursue science. She takes students from the Perkins School for the Blind on field trips to Vineyard Sound, off the coast of Massachusetts. They’re often thrilled that she uses a screen reader, just like they do.
Those with vision impairment, she tells them, can approach science differently. Bower doesn’t get lost in charts with millions of data points because she can’t see them. “I tend to spend more time thinking and talking to people about the big picture,” she says. “What does it all mean?”
These days, Bower isn’t slinging instruments on research cruises much anymore. Instead, when she’s not busy with headings and weather forecasts, she uses her mobility cane to navigate the ship deck, up ladders and through passageways she knows by heart. In the open air, she revels in the awe-inspiring privilege of experiencing the world thousands of miles from shore. She likes to listen to the hiss of the ship slipping through the waves.