What I Learned From Wildfire Risk Tools
Fire maps are better than ever. Are we ready to use them?

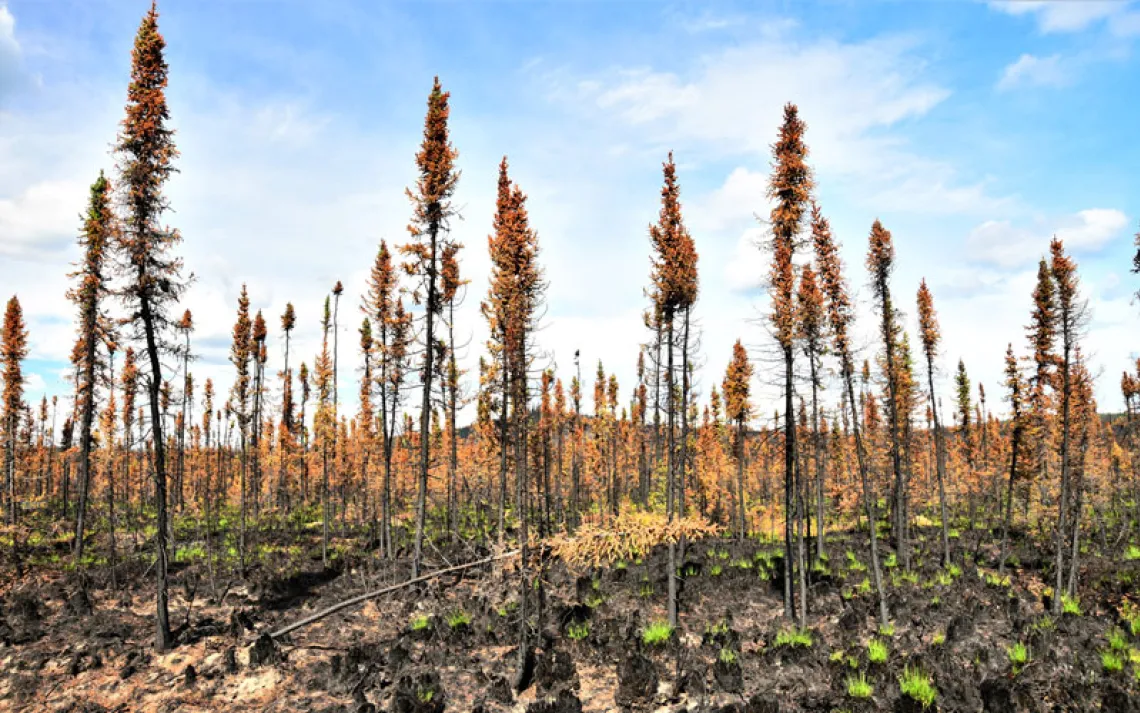
Photo by iStock.com/ftwitty
Wildfire is always on my mind: I live in a wooded rural community in southern Oregon that has been in a drought for several years. Fir trees are dying at an alarming rate, and nearby springs have slowed to a trickle. Since I moved here in 2014, at least two large wildfires have threatened our community; several smaller fires were snuffed out before blowing up.
I’m certainly not alone. First Street Foundation, a nonprofit research and technology group that provides open-access risk data, estimates that 71.8 million homes in the US are in some level of danger from wildfires in 2022. That number is projected to rise to 79.8 by 2050.
Already, the number of structures lost to wildfires is increasing, according to data from Headwaters Economics. The most destructive years in history have occurred recently, in 2017, 2018, and 2020. Wildfires are also destroying homes in unexpected places. This July, dozens of homes in London burned after an unprecedented heat wave sparked grass fires that then blazed into neighborhoods. Last December, the wind-driven Marshall Fire destroyed more than 1,000 homes in a Colorado suburb.
As the wildfire risk has grown, stakeholders—from state governments down to the individual—are urgently trying to better understand the dangers they face.
In response to that burgeoning need, fire risk modeling has grown ever more sophisticated; it’s critical for helping communities plan and protect themselves. But up until now, individuals have had little access to the valuable data they provide. So when I learned about Risk Factor, the First Street Foundation’s new, free-to-use tool to assess property-level wildfire vulnerability over the next 30 years, I decided to give it a try.
*
After I entered my address, the Risk Factor website promptly produced an assessment for both wildfire and flooding. According to the tool, my property’s fire factor is “major,” or five out of 10. My home faces an 8.33 percent chance of being in a fire within the next 30 years. The risk worsens over time, thanks to climate change.
Broader risk varies with geography. Dark orange and red blotches on Risk Factor’s national map depict fire-prone “hot spots” across the West, Southwest, and Florida. Midwestern states and New England are colored in cool shades of blue and pale yellow.
On a nationwide level, risk maps like these are built using modeling of how and where fires might spread. To create them, modelers run thousands of simulated fire seasons, explained Greg Dillon, director at the US Forest Service’s Fire Modeling Institute in Missoula, Montana.
“If we run, say, 20,000 iterations of fire seasons, we will generate 20,000 synthetic seasonal weather streams,” he said. “This way we capture both the extremes and the averages.” Ignition points dropped on the map start thousands of hypothetical fires, their size and extent determined by vegetation, weather, and other factors.
Different maps serve the widely varied stakeholders facing worsening fire seasons. The Fire Modeling Institute’s Wildfire Risk to Communities map helps towns and counties understand their risk profiles, while its Wildfire Hazard Potential map helps the agency set priorities for reducing fuel loads in national forests.
*
What those high-level maps don’t offer is information tailored to individuals. “Ours is truly the first time that an assessment of property-level wildfire risk has been conducted,” Michael Lopes, a First Street Foundation representative, told me.
Such granularity helps homeowners better understand their risk and what steps they can take to mitigate it. Using the tool, potential buyers can assess the risks associated with a given property and how those risks may change over the life of a 30-year mortgage.
To build their tool, the First Street Foundation simulated over 100 million wildfires to see which would be likely to grow and cause property damage. Then they compiled data from more than 8 million of the simulated fires. In these maps, buildings are burnable fuel, which influences how a fire might spread from property to property. Vegetation data has been adjusted to reflect how recent real-world fires—whether planned “prescribed” fires or wildfires—may have altered onsite fire risk by consuming flammable materials.
Part of the Risk Factor report included an assessment of my home’s specific vulnerabilities. My roof is fine, it noted, while flagging potential issues with my home’s siding and nearby vegetation.
I asked Lopes how the tool “knows” that my house is surrounded by trees, has a metal roof, and is clad in engineered wood. In an email, he explained that information about individual properties comes from local assessor’s offices, third-party sources including MapBox, and satellite imagery.
“We also used aerial imagery to compute ‘defensible space’ for every home in America,” Lopes wrote, referring to the recommended buffer between homes and an oncoming wildfire. “If there are burnable materials or ‘fuels’ within 50 feet of a home, it dramatically increases its likelihood of being impacted.”
*
Risk Factor may have been the first publicly available wildfire risk tool to provide property-level risk ratings, but it already has company. Just a few weeks after Risk Factor’s May release, Oregon unveiled an updated version of Oregon Explorer, a wildfire risk tool that now includes individualized data. It generates a “homeowner’s report” when prompted with an address.
Oregon’s tool classifies my property’s risk as “extreme.” That’s its highest category, and based on my area’s wildfire history, it seems more accurate than the five out of 10 rating I got from Risk Factor. Dillon explained that the Oregon Explorer map uses the same framework as the Forest Service’s Fire Modeling Institute, only refined for the Pacific Northwest.
“Each time you go down a scale in geographic specificity, you can calibrate [the model] based on what you know about your landscape,” said Dillon. Detailed information from local experts can be used to adjust fuels data, for example, following fires or timber harvesting.
Adding layers to the Oregon Risk Explorer map reveals the perimeters of historic fires. I learned that in 1914, a fire impinged on what is now our six-acre parcel, which makes me think of the charred, fire-hollowed snag I pass on my daily walks. I can also see the outlines of the 35,000-acre Oregon Gulch Fire, which burned perilously close to my community in 2014, and the 2020 Almeda Fire that devastated nearby Rogue Valley.
When I asked Dillon about differences between Risk Factor and the Oregon Explorer assessments, he suggested a wait-and-see attitude. “Being able to do a national scale and risk rating for every property is ambitious; it’s going to take some time to work out the kinks,” he said. “But anything like this that gets people talking about wildfire risk and thinking about what they need to do is a good thing.”
*
Neither tool is perfect. In Oregon, some property owners are already protesting that their risk rating doesn’t match the reality on the ground. That tension points to a thorny question: How will these property-level risk maps be used?
Oregon’s new map is already being used to identify high-risk properties, as mandated by the state senate. Coming soon are new building codes and requirements for creating defensible space around homes in these areas.
Some worry that insurance companies are going to use the new ratings to raise rates, or even deny coverage. In Oregon, officials have stated that, since insurance companies already use their own proprietary models to assess risk, publication of the map should not have a “significant impact” on rates. However, some Oregon property owners claim that their insurance costs have already gone up precisely because of the new risk map.
Meanwhile, the real estate platform realtor.com has integrated Risk Factor’s Fire Factor and Flood Factor into their listings. The “pro” version of Risk Factor, slated to be released in October, will include more in-depth analysis aimed at real estate professionals, presumably so they can help prospective buyers understand what they’re getting themselves into.
Good idea. Having witnessed the effects of the drought and endured the anxiety of multiple fire seasons, I wasn’t surprised to learn I live in a high-risk wildfire region. But when I first moved to Oregon 22 years ago, I was clueless.
John Rizza, regional fire specialist for Oregon State University’s Forestry and Natural Resources Extension Fire Program, believes real estate agents should be more proactive about helping prospective buyers understand why a particular property may be at risk. “Buyers come from wherever and don’t necessarily know about these things,” he said.
Still, he urges people to not get too invested in a particular risk rating. Instead, they should apply the principles of home hardening to help their dwellings better survive a wildfire, should one arrive. This includes removing combustible materials from around the house and making the building itself more resistant to embers. One thing is sure: More fires are coming.
“As we have seen in past events, wildfire can affect anyone—regardless of risk map definitions,” Rizza said.