A new study commissioned by the Sierra Club, "Coming Clean on Industrial Emissions: Challenges, Inequities, and Opportunities in U.S. Steel, Aluminum, Cement, and Metcoke", takes an in-depth look at heavy manufacturing facilities around the country.
At the heart of the report is a new database that examines every domestic facility in four heavy industries that were in operation in 2020: 100 facilities that produced primary iron and steel, 12 merchant facilities that produced metallurgical coke for the iron and steel industry, 96 facilities that produced cement, and 7 that produced primary aluminum.
Uncertainties in Public Data
Review of studies and interviews with industry experts revealed that the accuracy of publicly available greenhouse gas emissions data and toxic emissions data from heavy manufacturing facilities is uncertain, largely due to the leeway those facilities enjoy in how they report the data to the U.S. Environmental Protection Agency (EPA).
This study reveals that many industrial facilities use unreliable estimations when reporting on their greenhouse gas emissions, and have so much flexibility when reporting on their toxic emissions, that it creates significant uncertainty in the reliability of reported figures.
Reported Greenhouse Gas Emissions
Too many facilities rely on the least reliable estimations when reporting either combustion emissions or process emissions to the EPA.
Greenhouse gas emissions reported to the EPA are categorized as either combustion emissions or process emissions.
Combustion emissions include carbon dioxide (CO2), methane (CH4), and nitrous oxide (N2O) emitted from combustion of a fossil fuel (e.g., coal, natural gas, petroleum products) or biomass feedstock (e.g., wood, landfill gas).
Process emissions include emissions from chemical transformation of raw materials. The chemical transformation of raw materials often releases greenhouse gases such as CO2, CH4, and N2O. These processes are prevalent in iron, steel, and cement production. Process emissions also include fugitive emissions, which refer to emissions of gases due to leaks or other unintended or irregular releases.
Tiers of Emissions Calculations
The EPA designates four tiers of emissions calculations, with Tier 4 being the most accurate and Tier 1 being the least accurate.
- Tier 4: The measurement relies on continuous monitoring of both the stack gas CO2 concentration and the stack gas flow rate.
- Tier 3: Characteristics of the fuel used, such as carbon content and molecular weight, are used in conjunction with the measured fuel quantity to calculate emissions.
- Tier 2: Representative values for the quantity of pollutants released through a particular industrial activity and energy produced from the combustion of a fuel source are used in conjunction with the estimated fuel quantity to calculate CO2 emissions.
- Tier 1: Default values for pollutant releases, energy from fuel combustion, and estimated fuel quantity are used together to calculate emissions.
The following table shows the quality of the reported greenhouse gas emissions data from each of the industries examined by the Sierra Club (Tier 4 is the most accurate, Tier 1 is the least):
Industry | Combustion Emissions | Process Emissions |
Iron and Steel, Metcoke | Tier 1, Tier 2 | Tier 4 |
Aluminum | Tier 1, Tier 2 | Tier 1 |
Cement | Tier 4 CEMs (90% of facilities) | Tier 1 |
Reported Toxic Emissions
Like their reporting on greenhouse gas emissions, industrial facilities have significant flexibility in how they generate toxic release figures submitted to the EPA. The most frequently used method to estimate facility-level toxic emissions relies most heavily on assumptions and subjective judgment, creating uncertainty around the reliability of the reported figures.
The EPA allows facilities reporting to Toxic Releases Inventory to choose among four methods to develop estimates of chemical releases. Although each of the methods can be very accurate, the range of possible accuracies does vary within method categories.
- Method M (direct measurement) relies on continuous, periodic, or random monitoring of emissions from facilities. This is considered one of the least variable and most accurate measurement methods. Nonetheless, reporting should take care to reflect that the measurement of what is released assumes efficient combustion of chemicals under ideal operating conditions at the facility. Downtime and process interruptions should be reported to reflect releases that may not have burned as intended. .
- Method C (mass balance) calculates releases based on chemicals entering and leaving equipment. This measurement can also be very accurate if proper site-specific data is used, but the EPA warns that all inputs and outputs must be included with as much precision as possible or the final estimate of a pollutant will be inaccurate.
- Method E (emissions factors) uses figures developed by experts that represent the relationship between the amount of a pollutant produced and the amount of raw material processed or burnt to approximate chemical releases. The reliance on representative figures creates uncertainty around the accuracy of the figures..
- Method O (engineering calculations) uses mathematical formulas to estimate the chemical releases. This method is only as accurate as the best engineering judgment of the person making the calculations or the calculation used. Engineering calculations are ultimately “assumptions or judgments” that rely on thorough knowledge of processes at a facility.
While facilities may be able to improve the accuracy of toxic release reporting by performing direct measurement of pollutants, the EPA does not require additional sampling or testing under Toxic Releases Inventory. In general, the EPA empowers the facilities to “determine the best method for calculating quantities of each release” based on “site-specific knowledge and potential data sources available.”
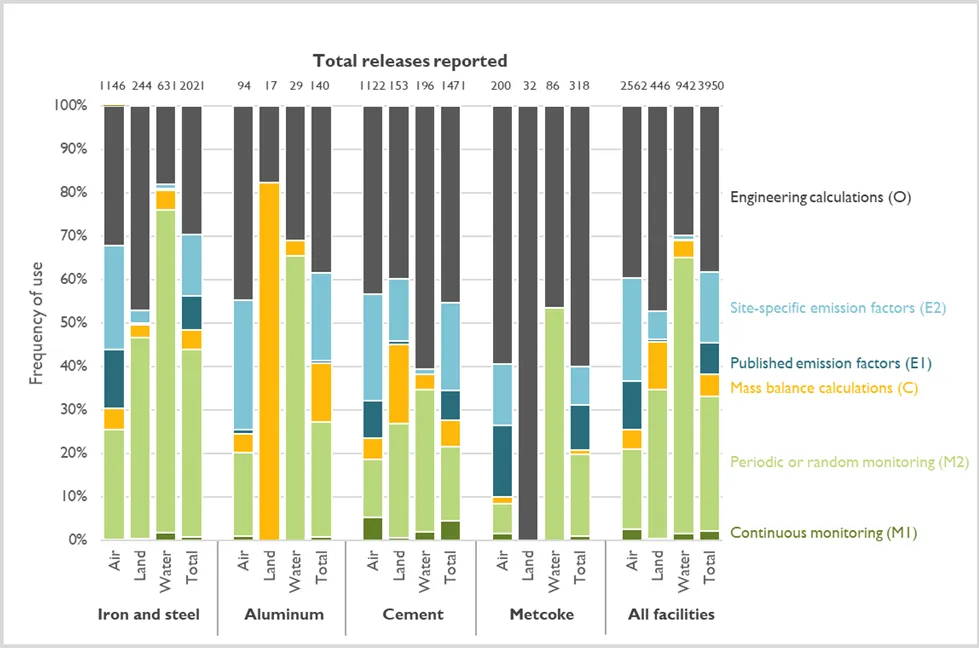
The dominant method used to estimate facility-level toxic emissions is “engineering calculations” — the method that relies most heavily on people’s assumptions and judgment. The least frequently used method is continuous emission monitoring — one that is considered one of the least variable and most accurate methods.
Assigning Grades
The report commissioned by the Sierra Club assigned the following letter grades to the reliability of the air, land, and water toxic release data from each of the facilities.
| Facility Type | Air | Land | Water |
| Iron and Steel | B | B | A |
| Aluminum | B | A | A |
| Cement | B | B | C |
| Metallurgic Coke | C | D | B |
Conclusion
Given the consequential impacts of these industrial facilities on the economy, environment, and communities, good data is vital for making good policies and taking constructive action. This includes understanding the specific effects of each industry at large, as well as the impacts of individual facilities.
To ensure that the publicly-available data provides an accurate accounting of industrial emissions to local communities, the EPA should include stricter reporting standards for industrial facilities. More immediately, the EPA could include qualifications (or a letter grade) in their publicly-released figures that provide communities with an understanding of the reliability of the data presented.