John Holtzclaw
I've been asked many times if there is a threshold residential density above which many more residents take transit. I have said it seems to be between 5 to 15 households/residential acre. Or, is there a density above which people are willing to walk or bike? And the answer seems to be similar. The increase in these trips reduces driving trips (and lengths, but that’s another story).
San Francisco Bay Area
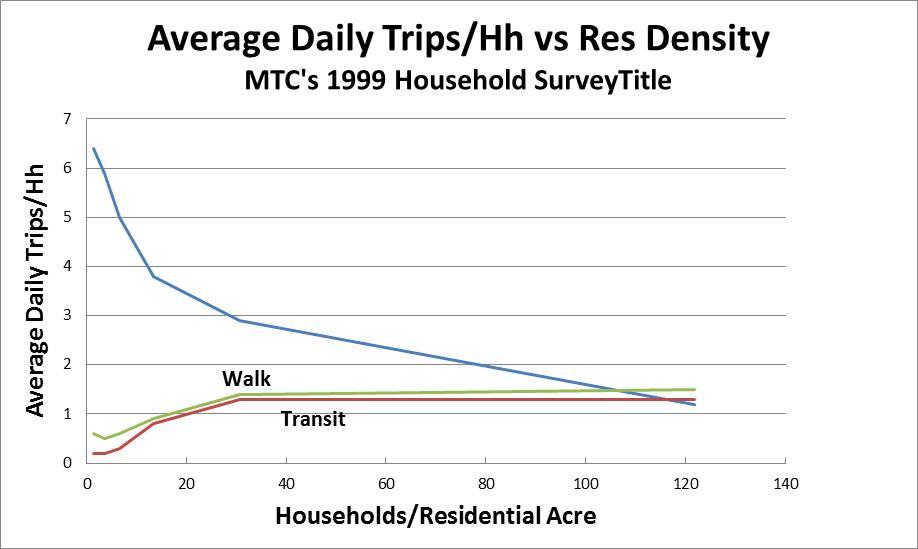
In 1990 the Metropolitan Transportation Commission surveyed over 10,000 households on one or more days for each trip: reason, origin, destination and mode. I aggregated these reports by the residential density of the household’s zone. Residential density is the number of households in the zone divided by the number of residential acres, and is an excellent measure of the neighborhoods we live in. It is preferred over population (or households) per total acre because many zones contain other land uses which dilute the measure. A zone, for instance, might contain a compact, walkable neighborhood surrounded by parks or rural land, giving a population/total acre which is far below the neighborhood density residents experience daily. While another zone containing only housing could appear to have a higher density but really be much more sprawled out and less inviting to pedestrians, bicycles and transit use. Or a dense urban zone which includes a handy commercial and office area and local parks would also have unrepresentatively low population or households per total area.
MTC’s survey seems to tell us that transit use rises from 0.2-0.3 daily transit trips/hh at 6 or 7 hh/res ac to 1.3 daily transit trips/hh at 30-50 hh/res ac, above which it declines very slowly.
Walking also starts rising from about 0.6 walking trips/household at about 6-7 hh/res acre, doubling to 1.4 trips/hh at 30 hh/res acre, and continues rising slowly to 1.5 trips at 120 hh/res acre (3-5 story condos and apartments with occasional high-rises). These increases in walking and transit use help explain why, in the San Francisco area, vehicle miles per household fall over 40% every time neighborhood density doubles.
These results parallel the studies of driving, transit use and walking trips among European cities. Denser cities have less driving per capita. Transit trips per capita increase with density until they reach a maximum at moderate densities and fall or remain constant at higher densities. Walking continues rising as density increases.
And this makes sense. When density increases driving falls as trip lengths are shortened and more can be taken by transit or walked or bicycled. (Unfortunately, there were too few bicycle trips in the MTC survey to lead to firm conclusions, although they averaged about 0.1 trips/hh, rising to about 50% higher between 10-20 hh/res ac.) Transit trips increase with density until trip distances become short enough that more are taken by bicycle and foot. Walking trips continue to rise with density as they become more and more convenient. The table below shows the mean values from MTC's 1990 household travel survey.
Daily Trips by Density, from MTC's 1990 Household Travel Survey
Households/Residential Acre <2 2-5 5-10 10-20 20-50 >50Mean Hh/Res Ac 1.4 3.6 6.7 13.5 30.6 121.9
Daily Veh Trips/Hh 6.4 5.9 5.0 3.8 2.9 1.2
Daily Transit Trips/Hh 0.2 0.2 0.3 0.8 1.3 1.3
Daily Walking Trips/Hh 0.6 0.5 0.6 0.9 1.4 1.5
United States
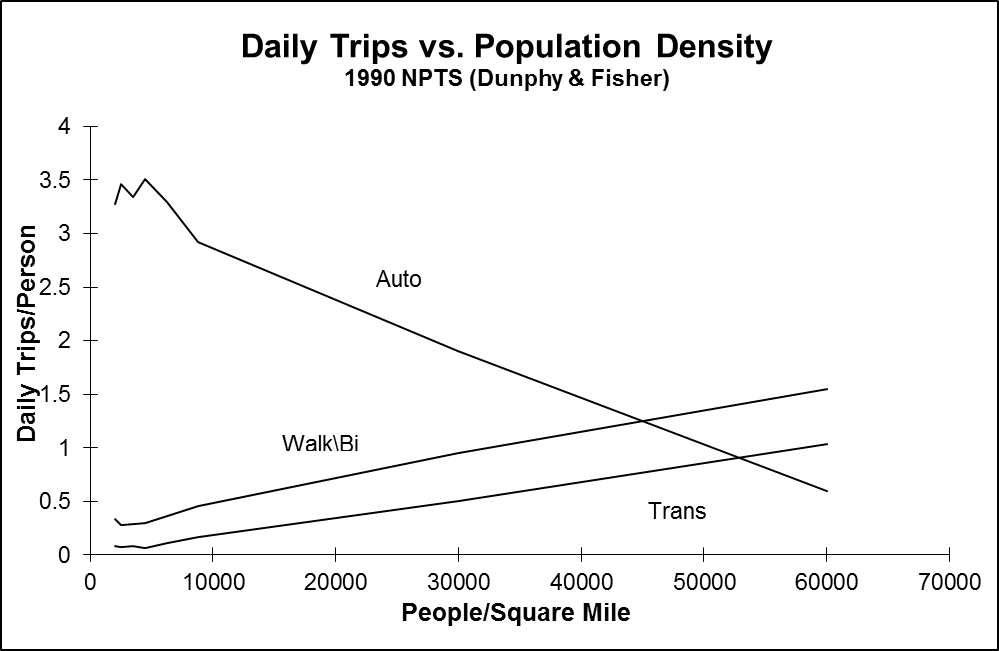
Dunphy and Fisher (“Transportation, Congestion, and Density: New Insights,” Transportation Research Record, No. 1552, Washington DC: Transportation Research Board, Nov. 1996, Table 5) aggregated the 1990 National Personal Transportation Survey (NPTS) by the population per square mile of the household’s ZIP code. As described above, the utility of this measure is clouded by the inclusion of nonresidential land (commercial, industrial, parks and other open spaces) in some zones, while others are wholly residential. Nevertheless, that is the only density measure the U.S. Census Bureau provides by ZIP code.
The data show that auto trips decline with increasing population density, as expected. These data indicate a near linear increase in public transit and walking-biking trips per capita with increases in population density above 4500 persons/square mile. Transit trips increase with density from a low of about 0.07 trips/capita below 4500 persons/square mile (about 4 households/residential acre in a residential-only zone) steadily up to 1.03 at the highest density of 60,000 (perhaps 100 hh/res ac in a mixed-use zone). Walking and bicycling trips also increase steadily with density above 4500 persons/square mile from 0.3 per person to 1.55 at the highest density aggregate.
Density vs. Daily Trips, from Dunphy and Fisher
Per/Sq Mi Auto Trips/Cap Tr Trips/Cap Walk\Bike/Cap2,000 3.28 0.08 0.33
2,500 3.46 0.07 0.28
3,500 3.34 0.08 0.29
4,500 3.51 0.06 0.30
6,250 3.29 0.11 0.36
8,750 2.92 0.16 0.45
30,000 1.90 0.50 0.95
60,000 0.59 1.03 1.55
Chicago, LA and San Francisco metro areas
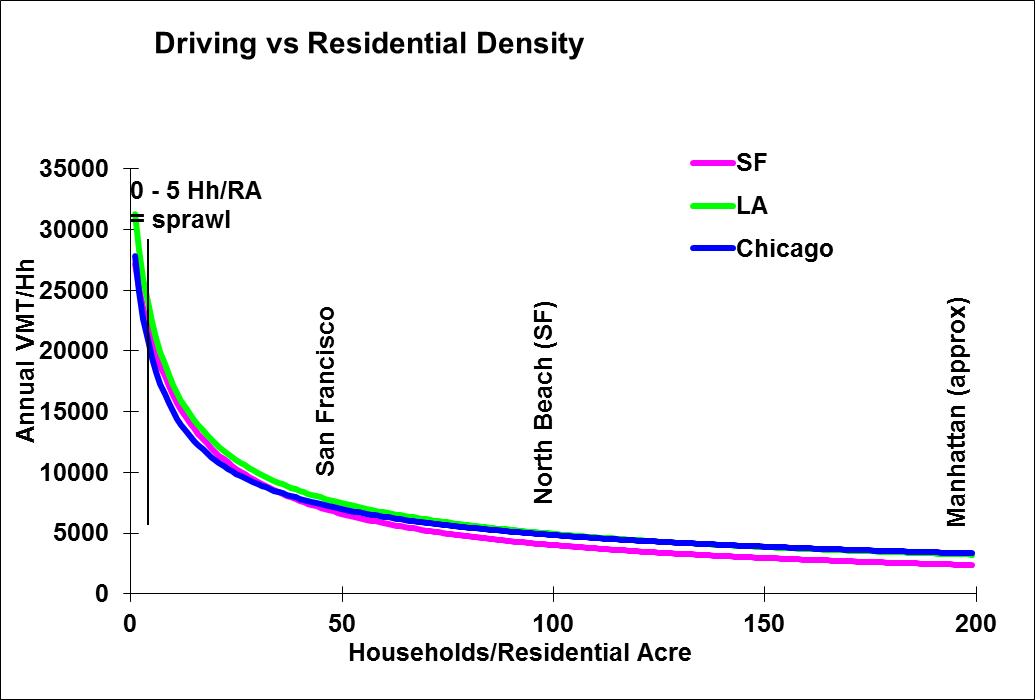
Studies of every Travel Analysis Zone (census tract) in the Chicago, LA and San Francisco metro areas show convincingly that increasing residential density reduces household auto ownership and driving, and increases local transit service and pedestrian/bicycle friendliness. Further, it shows that increases in local transit service and pedestrian/bicycle friendliness decrease auto ownership and driving. The average annual household mileage at various residential densities is shown below. Note that the patterns are almost identical between: 1) a frostbelt city built on a plane next to a large lake; 2) a sunbelt city built in valleys; and 3) a sunbelt city built along bays and rivers. As local density increases the mileage falls dramatically. Unfortunately, most of the cities built since WW II have been in sprawl, 0 - 5 households/residential acre. The average residential density for all of San Francisco, North Beach in SF, and Manhattan are noted for reference.
Want better transit? Suppport nearby condo and apartment construction, and mixed use development!