Energy Burden Across the US
Energy Burden Across the US
Energy bills are rising, straining household budgets. Energy Burden is a measure of this strain and can point to communities and areas that are struggling the most.
Who is Carrying the Energy Burden?
Learn more about the outsized impact on low-income, Black, and Native American households with the Sierra Club Energy Burden Dashboard, then join us in advocating for more affordable solutions like renewable energy to reduce this strain.
State of Play: Surging Energy Costs
If your energy bills seem unusually high lately, you are not alone. Families across the United States are paying more for electricity and gas than they have in many years. Between January 2025 and January 2026, home electricity prices rose nearly 9.5%. Home methane gas prices increased about 12%.(1) During the same period, utility companies across the country raised rates or asked for rate increases totaling $93 billion.
A Sierra Club analysis found that the average monthly electric bill reached $146 by the end of 2024. US households then paid $116 more in 2025 than in 2024 on electricity bills.
This is unsustainable.
Energy Burden: A Measure of Affordability
Rising energy costs don’t impact all households equally. Many families already struggled with high energy bills because of a legacy of historical discrimination like redlining, poor housing conditions, and limited access to energy efficiency programs and incentives. The result: a disproportionate share of household income going toward basic energy needs like electricity, cooking, heating, and cooling.
A key measure of this strain on households is Energy Burden. Energy Burden is the percentage of gross household income spent on energy costs. The US Department of Energy defines high energy burden as spending 6% or more of income on energy costs. The American Council for an Energy-Efficient Economy (ACEEE) considers spending 10% or more as severe energy burden.
Energy Burden is fundamentally an Environmental Justice and Energy Justice issue. Research has shown that Black, Indigenous, and People of Color (BIPOC) and low-income households face disproportionately higher energy burden. These households are forced with impossible tradeoffs between necessities like healthcare, food, energy, and safe and secure living conditions (Homsy and Kang 2025; 2024 ACEE; ACEE 2020; Lyubich 2020; Kontokosta, Reina, and Bonczak 2019; Hernández 2016).
Sierra Club’s Energy Burden Dashboard
The Sierra Club is fighting to make energy affordable, safe, clean, and equitable. Our Energy Burden Dashboard empowers the public to explore energy burden across the country. It includes energy burden values for census tracts across all 50 states and DC, and produces community-level energy burden stats that can be compared to statewide figures. The dashboard also provides maps of key community indicators for race, health, economics, and housing.(2)

Energy Burden Across States
Using the dashboard data, Sierra Club conducted energy burden analyses for states, households at different income levels, and race and ethnic groups.
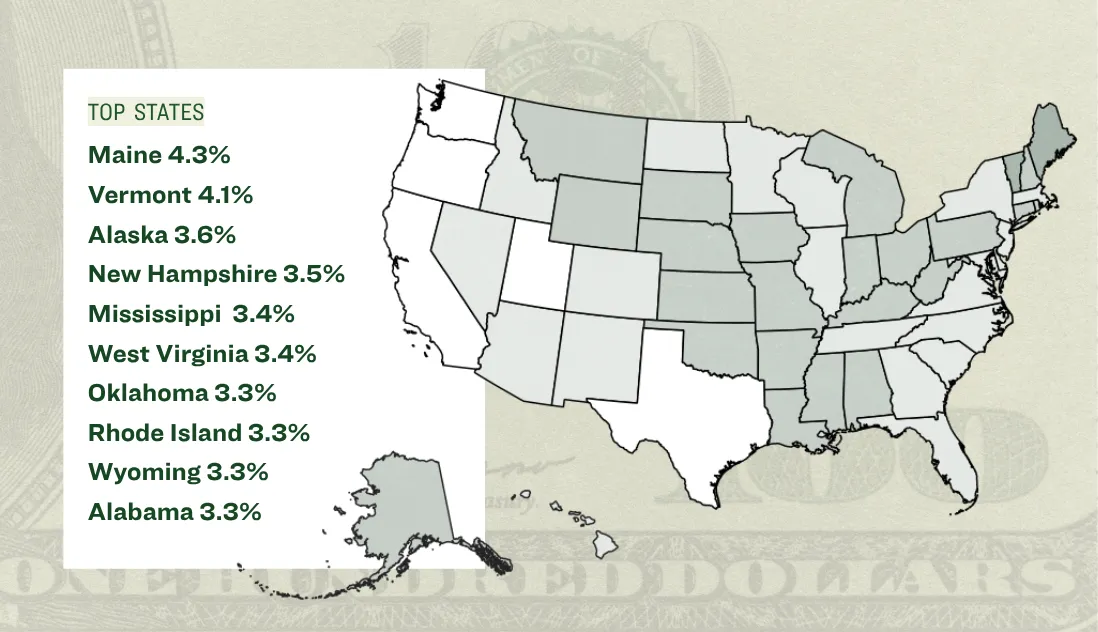
Average energy burden for the 50 states and DC ranged from 1.5% to 4.3%. This includes households at all income levels. New England states like Maine, Vermont, and New Hampshire topped the list of states with the highest energy burden. New England’s reliance on fuel oil contributes to high energy costs. Fuel oil is expensive, subject to price volatility, and must be delivered to the region. Maine, in particular, has had large increases to residential electricity prices in recent years. Other top energy burden states like Mississippi, West Virginia, Alabama, and Oklahoma are some of the states with lowest median household income.
All Households Average State Energy Burden
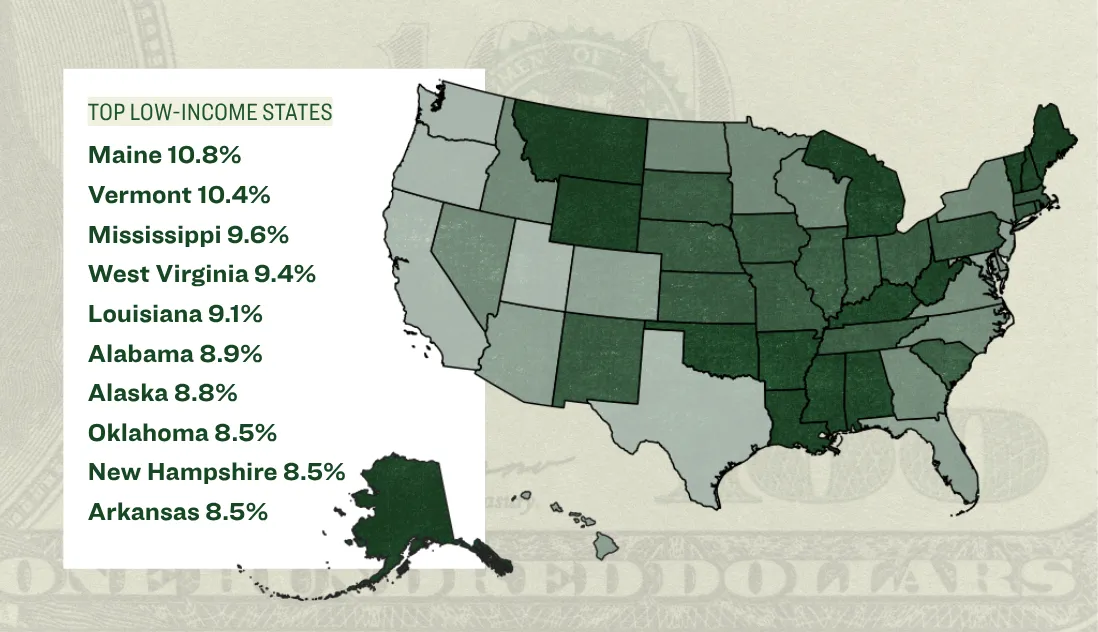
When only considering low-income households (80% Area Median Income and below), there are much higher burdens. The energy burden per state ranges from 4% to nearly 11%. The majority of states exceed the 6% high energy burden threshold. The top ten states do not change much, but the differences in average energy burden are staggering. Their average energy burdens are greater than 8%. The top two states, Maine and Vermont, reach a severe energy burden, above 10%. Energy costs for lower-income households are often exacerbated by poor housing stock, a lack of access to efficiency programs and incentives, and barriers to more affordable energy technologies like solar.
Low-Income Households Average State Energy Burden
Disproportionate Impacts on Communities of Color
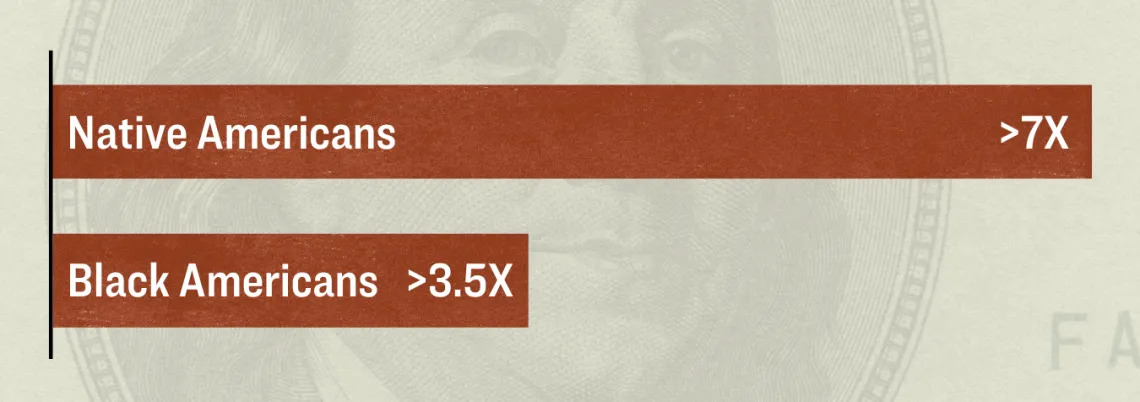
Black and Native Americans are overrepresented among high energy burden census tracts across the United States. Black Americans make up 11.9% of the population across all census tracts, but account for 42.7% of residents in high energy burden census tracts. Similarly, Native Americans make up 0.5% of the overall population, yet account for 3.7% of residents in these communities. Compared with their share of the overall population, Black and Native Americans are represented in high energy burden communities at rates more than 3.5 times and 7 times higher, respectively.
Overrepresented Groups in High Energy Burden Census Tracts
The drastic overrepresentation of both groups aligns with previous findings. A recent study showed that, even when accounting for income, majority Black census tracts face significantly higher average energy burden. It pointed to housing conditions, such as average building age, and homeownership rates as major factors that overburden Black households. The DOE reported that on average, Tribal households face an energy burden that is 28% higher than the average for all US households.
Low-Income Households Are Spending Way More on Energy Bills For Every Dollar Earned
Energy bills don’t exist in a vacuum. The affordability crisis stems from nearly every household expenditure you can think of going up like housing, transportation, healthcare, groceries, child care, energy. While wage growth has stagnated and Trump’s tariffs cost families $1,200 each in 2025. For low-income households, the pain is compounded by deep cuts to key public benefits programs.
Average Energy Burden by Income Level
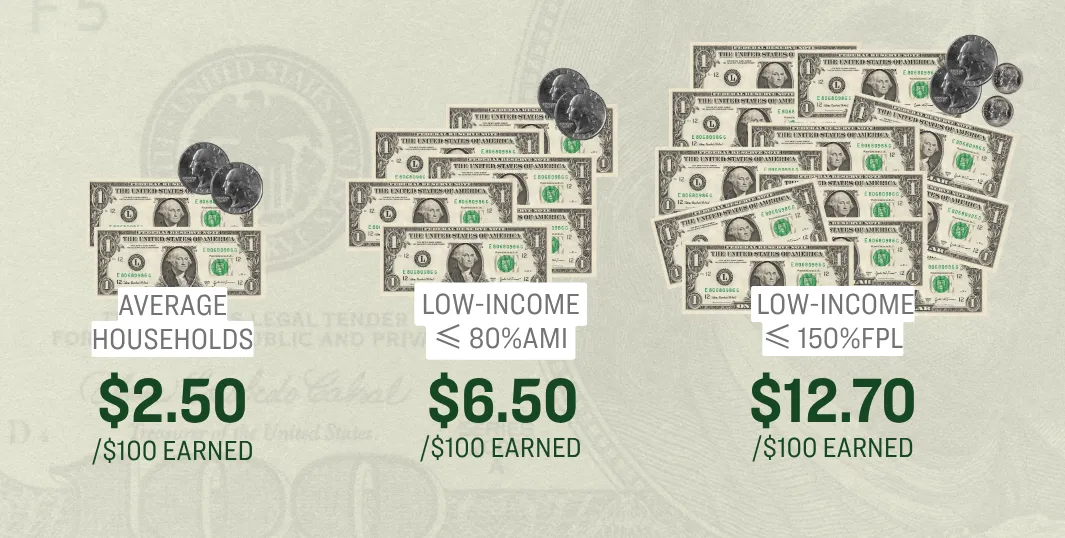
The energy burden data tells a story of stark contrast. Low-income households are spending substantially higher portions of their money on energy bills. The national average energy burden across all income levels in the US is 2.5%. This means on average, households spend about $2.50 for every $100 of income on household energy costs. This changes dramatically for low-income households. The Energy Burden Dashboard uses two common low-income measures: 80% of the Area Median Income (80% AMI) and below, and 150% of the Federal Poverty Level (150% FPL) and below. AMI is more region specific. FPL, which is the same for most households across the US, is often lower than median/middle incomes used in AMI. For households at 80% AMI and below, the national average energy burden was 6.5%, translating to $6.50 spent on household energy costs per every $100 earned. This nearly doubles for households at and below 150% FPL to 12.7% energy burden, or $12.70 spent on energy costs per every $100 earned.
Families are already stretched thin. Now, with surging electricity and home gas prices, low-income households are spending even more of their income on high energy bills, leaving even less to cover other necessities.
Solutions

The Trump administration has exacerbated the energy affordability crisis by cancelling lower-cost clean energy projects, subsidizing failing coal plants, gutting efficiency standards for appliances, and cutting key assistance programs.
The solutions already exist. What’s needed is the will to act to alleviate the oppressive energy burden too many households are shouldering. Solutions include:
- Move toward solar energy, energy efficiency, and community power, which are far less costly than polluting fossil fuel plants.
- Implement appliance standards, weatherization rebates and efficiency tax credits to put thousands of dollars back into families’ pockets.
- Stop the rate hikes that fund bailouts for dirty coal plants that should have been long gone.
- End the attacks on the Low-Income Home Energy Assistance Program (LIHEAP) – and expand it instead.
- Require data centers and hyper-scalers to pay their own way and invest in clean energy instead of passing the costs of dirty fossil power plants onto ratepayers.
- Activate states to enact efficiency standards, clean air and water protections, new rebate and tax credit programs, and policies that lead to fair rates for consumers.
Data Notes
Dashboard Features
- Energy Burden (broken down into All Energy Costs, Electricity Costs, Gas Costs, or Other Household Fuels)
- Energy Burden for Different Household Income Levels
- Race and Ethnic Group Demographics
- Redlining
- Health (Asthma, High Blood Pressure, Cancer, Recent Checkup, Lack Insurance, or Mental Distress)
- Rental Share
- Median Income
Community Filters
- Minimum Energy Burden for Census Tracts
- Predominant Racial and Ethnic Groups for Census Tracts
- States
- Metropolitan Statistical Areas
- Counties
- Cities (Approximate)
- Congressional Districts (Approximate)