To learn more, download our fact sheet: LNG Expansion Thwarts US and Global Climate Goals
If we told you that the Biden administration was on the cusp of approving 532 new coal plants, you’d probably be incredulous. President Biden has made tackling climate change a key issue of his presidency, and there’s scientific consensus that we need to be doing everything we can to move away from fossil fuels to have any hope of securing a liveable future. But the slate of proposed and under construction methane gas export terminals (referred to as LNG by the industry) facing the Biden administration would have the same emissions as those 532 coal plants.[1]
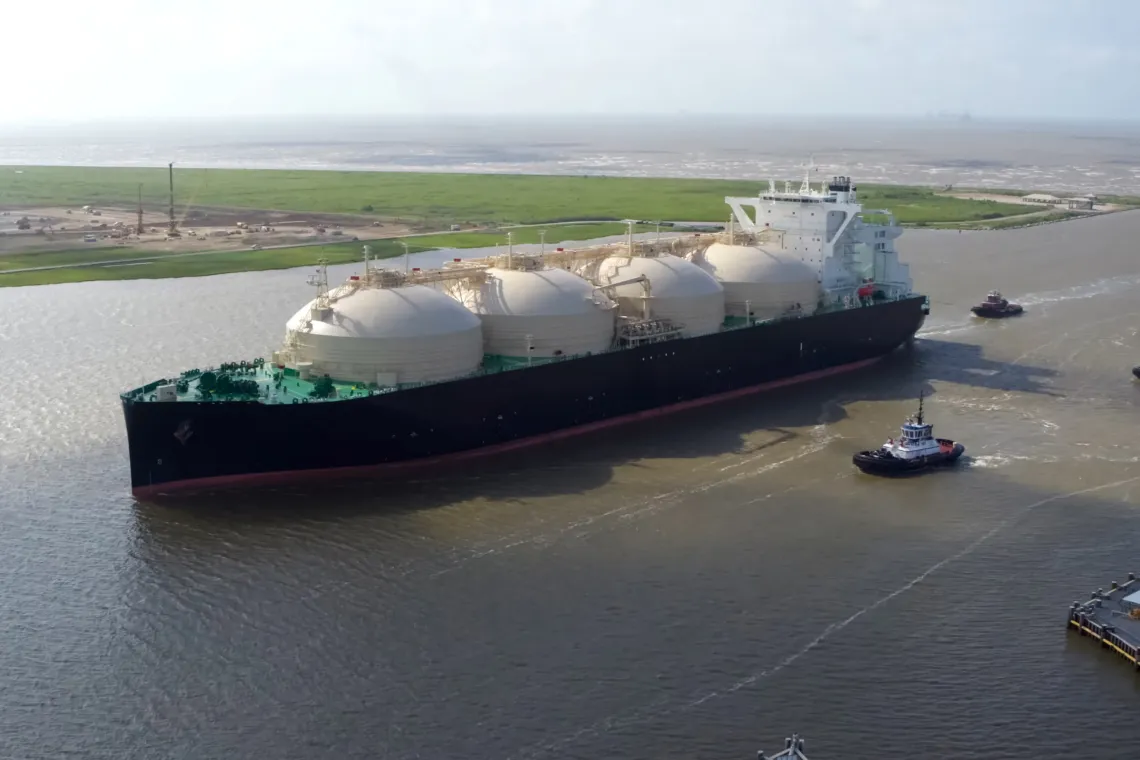
One methane gas export project, in particular, represents an outsized portion of the emissions from these projects: CP2 (or Calcasieu Pass 2), a massive methane gas export terminal proposed by Venture Global in southwest Louisiana. This gas liquefaction and export facility would join six other operating and proposed terminals in the Calcasieu ship channel, piling on to the already hazardous air quality in the region and further endangering the lives and livelihoods of local shrimpers and fishermen.
CP2’s application to export LNG is the single biggest application of all time. Venture Global has asked the Department of Energy (DOE) to let it export 3.96 billion cubic feet of gas per day at CP2.[2] The lifecycle emissions of fracking, liquefying, shipping, regasifying, and burning that much gas add up to 190 million tons of CO2e each year.[3] To put that into perspective, that’s over 20 times the annual emissions from burning the oil that would be produced at the Willow drilling project in Alaska[4] and equivalent to emissions from 42.4 million gasoline-powered cars or 51 coal-fired power plants.[5]
The Biden Administration has the power to stop this project in its tracks. Later this year or early next, the DOE will need to decide whether to approve CP2’s application to export LNG to non-FTA countries,[6] a critical permit that will determine CP2’s legal and financial viability. As stipulated in the Natural Gas Act, DOE can only grant this application if it deems CP2’s exports in the public interest of the American people. We know that locking the world into decades more of emissions-intensive fossil fuel infrastructure is not in the public interest, yet DOE has never rejected an LNG export application on this basis.
Unfortunately, this is not just about CP2. It’s a larger story of the continued expansion of LNG export infrastructure that threatens to undo our climate progress and put critical global and domestic climate goals out of reach.
The US has ambitious near-term and long-term climate goals: a Nationally Determined Contribution of 50-52% emissions reductions by 2030 and a commitment to net zero emissions economy-wide by 2050. But even with efforts to supercharge renewables and speed up economy-wide decarbonization, the gap between our emissions targets and trajectory continues to grow.
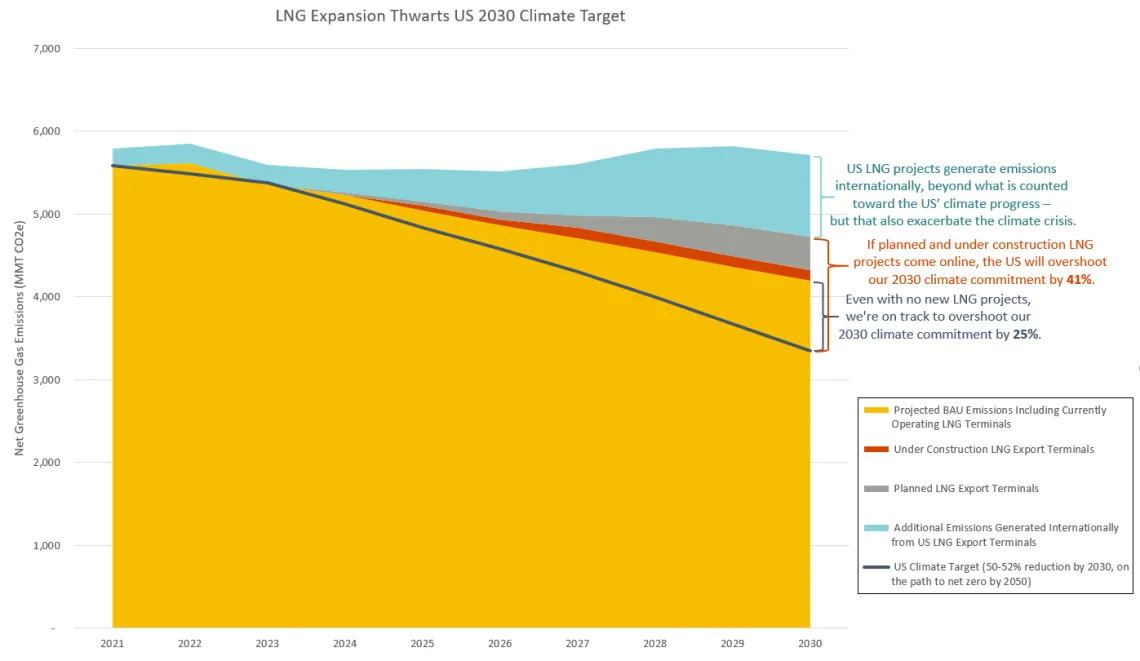
We looked at the extent to which LNG expansion would cause the US to overshoot our climate goals.[7] Under a business-as-usual (BAU) scenario, which includes the benefits of the IRA, the US will make some progress in cutting emissions by the end of the decade, with reductions of 25% below 2021 levels by 2030. However, if planned and under construction LNG terminals come online, a portion of that progress is wiped out, with emissions reductions of only 15% from 2021 to 2030. That is, these new LNG terminals would erase an enormous portion of our climate progress, in 2030 emitting more than one-third of what will be reduced by other measures.[8] And US LNG terminals generate nearly as many emissions internationally as domestically; these emissions are not counted on the US climate ledger, but they also worsen the climate crisis.
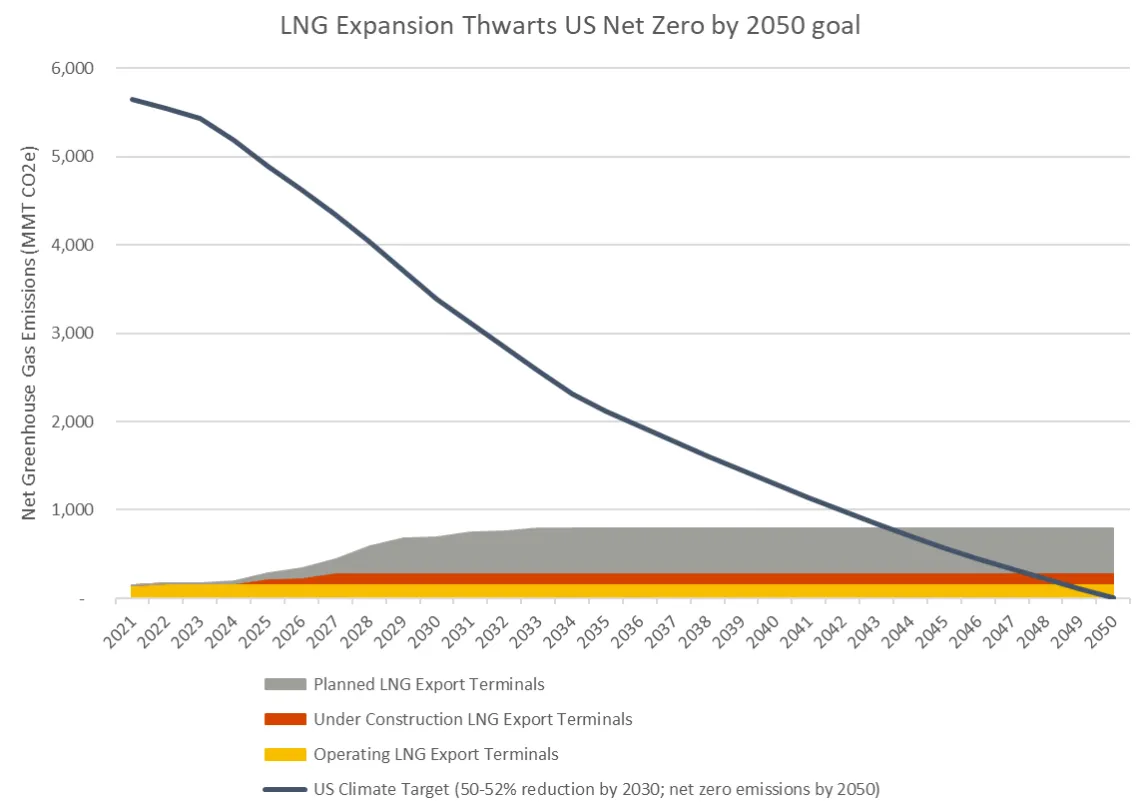
LNG buildout is also not compatible with the nation’s commitment to reach net zero emissions by 2050. If the methane gas export industry’s plans come to fruition, annual domestic LNG emissions will be 789 MMT CO2e[9] in 2050, when the US needs to have zeroed out its greenhouse gas impact. That does not even include the emissions from combusting the regasified LNG abroad, which threatens other countries’ 2050 net zero goals as well.
The Biden Administration has put forward strong climate goals because it believes that a liveable climate is in the public interest of the American people, yet its approach to LNG export approvals is a critical barrier to achieving those goals. In the past, DOE has assessed proposed LNG export projects using outdated and insufficient methods of measuring climate impacts, wrongly assuming that LNG exports yield net climate benefits and that project-specific emissions will be offset.[10] Scientific reports, including a recent peer-reviewed study from Brown University and RMI, have found that gas can be as bad for the climate as coal when only small methane leaks are factored in.[11] Meanwhile, the US Energy Information Administration has found that LNG exports are the driving force behind forecasted gas production growth.[12]
It is long past time for DOE to update and clarify how it considers climate in its public interest determinations. It can prove that it does so in a way that is consistent with the Biden administration’s climate policies by denying the LNG export application from CP2 – the biggest proposed export license of all time and a carbon bomb in the making.
[1] US LNG Export Tracker, Sierra Club, as of September 2023.
Sierra Club's methodology for calculating LNG lifecycle emissions is based on emissions estimates from the Carnegie Mellon study cited below, using the 20-year global warming potential (GWP) of methane, applied to the nameplate capacity of LNG terminals.
Leslie Abrahams et al., Life Cycle Greenhouse Gas Emissions From U.S. Liquefied Natural Gas Exports: Implications for End Uses - Supporting Information, Environmental Science & Technology, 2015, page 11-12.
[2] Application of Venture Global CP2 LNG, LLC for Long-Term, Multi-Contract Authorization to Export Liquefied Natural Gas to Free Trade and Non-Free Trade Agreement Nations, December 2021.
[3] We use the International Gas Union's conversion factors to convert from the application quantity in Billion Cubic Feet per Day (Bcf/d) to Million Tonnes Per Annum (MTPA). We then applied Sierra Club's typical methodology for calculating LNG lifecycle emissions described in note 1.
Natural Gas Conversion Guide, International Gas Union, 2012.
[4] Willow is expected to produce up to approximately 629 million barrels of oil over its 30 year lifespan, which would be equivalent to annual emissions of 9.02 MMT CO2/year.
Greenhouse Gases Equivalencies Calculator, Environmental Protection Agency.
Willow Master Development Plan, Final Supplemental Environmental Impact Statement, Volume 1: Executive Summary, Chapters 1 through 5, Glossary, and References, U.S. Department of the Interior and Bureau of Land Management, January 2023, page 2.
[5] Greenhouse Gas Equivalencies Calculator, Environmental Protection Agency.
[6] Countries with which the US does not have a Free Trade Agreement.
[7] This analysis uses the 100-year global warming potential (GWP) of methane, in order to align with economy-wide models of efforts to meet US climate goals, and thus paints a conservative picture of the negative impacts of LNG, given methane’s short-lived potency. Even with this conservative approach, LNG expansion is clearly at odds with our climate goals.
[8] Emissions pathway to meet the US climate target is from Energy Innovation’s Energy Policy Simulator.
Projected BAU emissions are from Rhodium’s Taking Stock 2023 Baseline, with the central scenario modified to hold LNG export emissions constant after 2030, in order to model a scenario where no new export projects come online. Emissions from US LNG export terminals are calculated by the Sierra Club using the methodology described in note 1, using the nameplate capacity in MTPA and assuming each project comes wholly online in the month that the developer currently projects. Sierra Club LNG emissions estimates typically use the 20-year global warming potential (GWP) of methane, but in this chart use the 100-year GWP for a consistent comparison with the other sources graphed.
[9] Million metric tons of carbon dioxide equivalent.
[10] Boom in LNG Could Add More Than 90 Million Tons of Greenhouse Gases a Year, Environmental Integrity Project, June 2022.
[11] Deborah Gordon et al., Evaluating net life-cycle greenhouse gas emissions intensities from gas and coal at varying methane leakage rates, Environmental Research Letters, July 2023.
[12] Annual Energy Outlook 2023: Release Presentation, Energy Information Administration, page 23.