By Cyrus Reed
The latest electric demand and supply projections from the Electrical Reliability Council of Texas (ERCOT) show that sunshine is in Texas’s future -- specifically solar photovoltaic power. According to the latest draft Long-Term System Assessment (LTSA) projections, more solar power is in our future, more than any other resource in fact.
ERCOT made draft projections for a variety of different scenarios:
Business as usual? More solar
High economic growth? More solar
Low natural gas prices? More solar
What if we get more extreme weather? More solar
What if there’s another recession? More solar
Lots of environmental regulations? More solar
New technology entries like electric vehicles and battery storage? More solar
Lots of energy efficiency and demand response? More solar
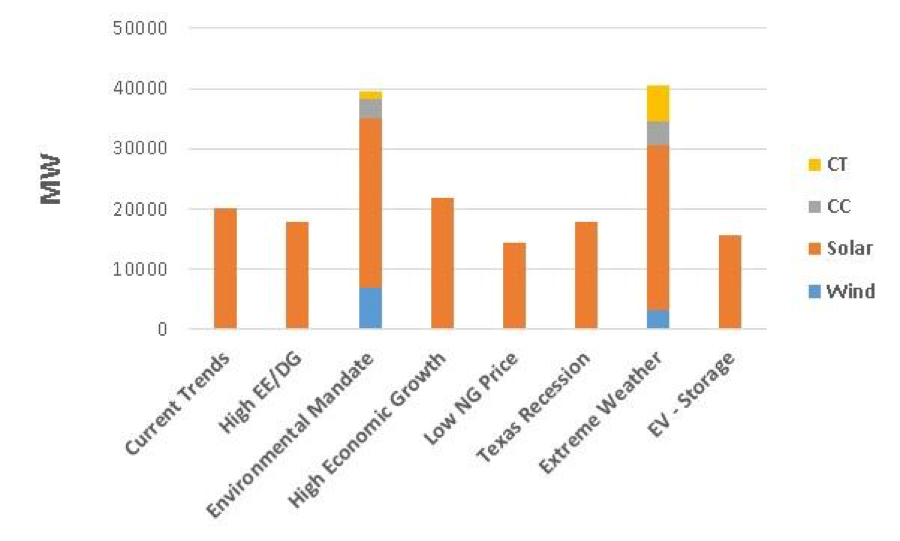
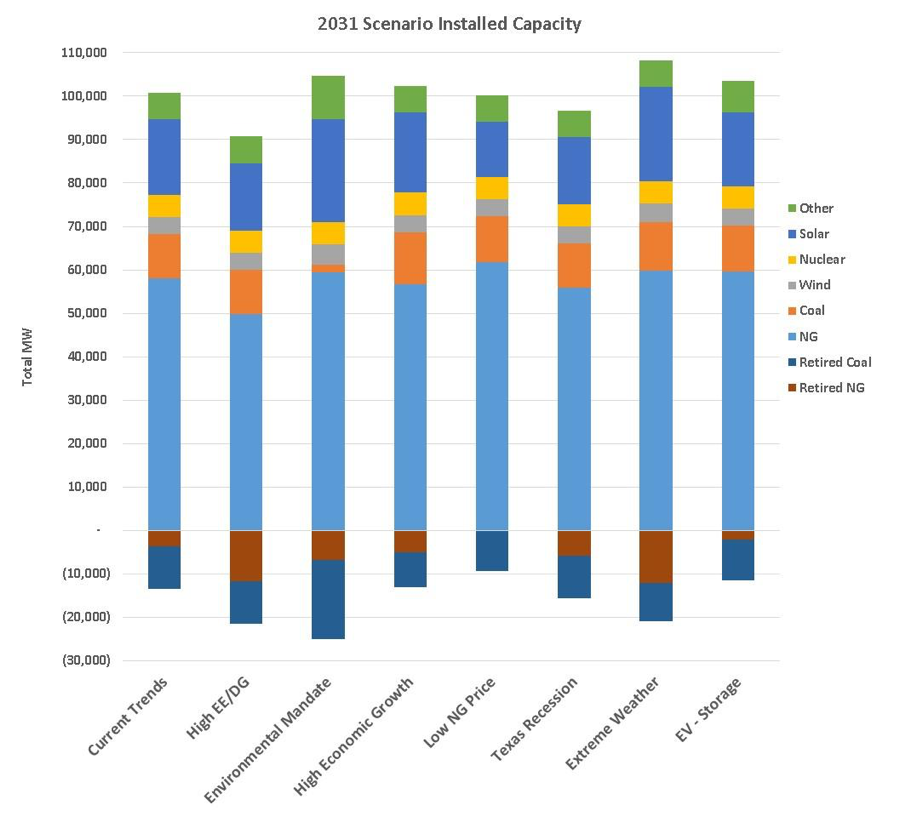
In all, ERCOT predicted that somewhere between 14,500 and 28,000 MW of utility-scale solar power would be added in the eight scenarios that are being developed over the next 15 years. While the results are preliminary (it is a draft after all), they point out a trend in ERCOT’s future: solar power is getting cheaper, and solar production matches the peak power needs of ERCOT’s market. In several scenarios, solar power would become Texas’s second leading resource behind natural gas by the end of 2031, while in the current trends scenario, wind and solar would each provide about 17 percent of Texas’s needs by 2031.
ERCOT’s Expected Capacity Additions by Resource Type


Essentially, every scenario modeled by ERCOT shows some retirement of older coal plants and steam natural gas plants, small additions of wind, and significant additions of solar. While some scenarios see significant investment in newer natural gas plants, others show little or no investment.
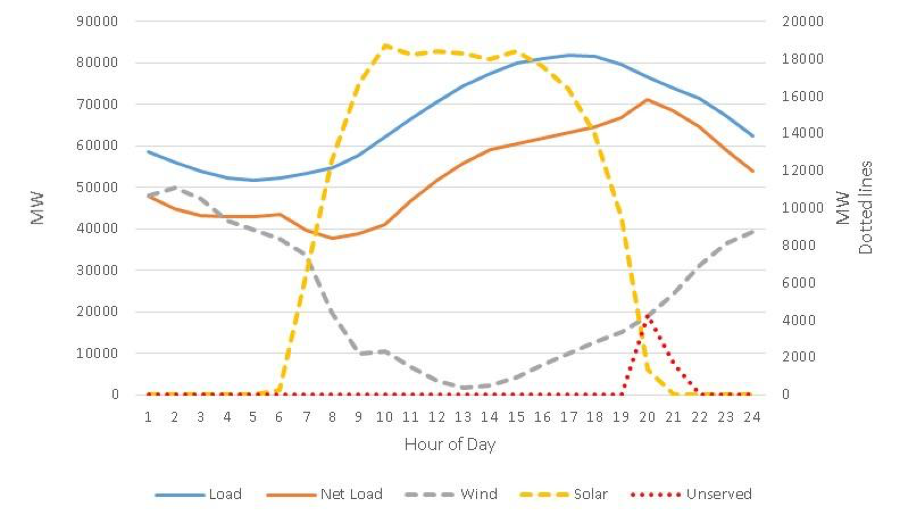
What is the Armadillo Curve and why is ERCOT slightly worried about it?
Ever heard of the Duck Curve? It was coined to describe a concern that California will use so much solar power that, in part due to the geography of the state, when the sun sets, there will be a gap in power supply as solar energy ramps down but demand is still high.
Well, some Texas officials have tossed around the term “Armadillo Curve” to describe something similar, but less severe.
The issue identified by ERCOT for the scenarios show a similar issue where there may be some hours of “unserved” energy in the early evenings after solar power drops off but before significant wind picks up to serve demand. The Armadillo Curve essentially resembles the ear of an Armadillo between about 7 and 10 PM before the wind power really picks up. ERCOT has started to refer to the Armadillo Curve in its presentations to distinguish it from the more traditional duck curve reference.
While it will be years from now before this may be an issue, it points to the need to develop other resources like energy storage and demand response, which could quickly respond to such quick changes in power production and electric demand.

What’s Next: More Study
ERCOT will now take two or three of the main scenarios (see above) and do a full needs analysis of transmission line capacity (poles and wires) to give stakeholders and policy makers some inkling of how Texas’s changing electric market landscape will influence the future location of power plants, and transmission infrastructure. The final report will be delivered to federal officials, the Public Utility Commission, and the Texas Legislature in December.