
February 20, 2025
To: Kirsten Struve, Jing Wu, Nai Hsueh, Shiloh Ballard, Richard Santos
Cc: Stephanie Simunic
Subject: 2/23/26 Water Supply and Demand Management Committee Item 5.1. Sierra Club comments on demand scenarios for 2025 Urban Water Management Plan
Dear Valley Water Staff and Water Supply and Demand Management Committee,
The Sierra Club is concerned about water supply planning in the San Francisco Bay Area. Specifically, we are bringing to policymakers’ attention how historic overestimation of future water demand has justified investment in unnecessary projects designed to increase imported water supplies. These supplies and projects come at the expense of the Bay-Delta ecosystem and the in-stream flows it needs to survive. They are also likely to come at the expense of ratepayer affordability. Therefore, we suggest Valley Water reconsider its demand scenario outcomes and also include an additional demand scenario in the 2025 Urban Water Management Plan (UWMP).
The Sierra Club has modeled water use in Santa Clara County and also taken a deep dive into the Bay Area Water Supply and Conservation Agency (BAWSCA) water demand model, which covers a significant portion of Santa Clara County. Please refer to the attached letter the Sierra Club sent to BAWSCA on December 4, 2025.
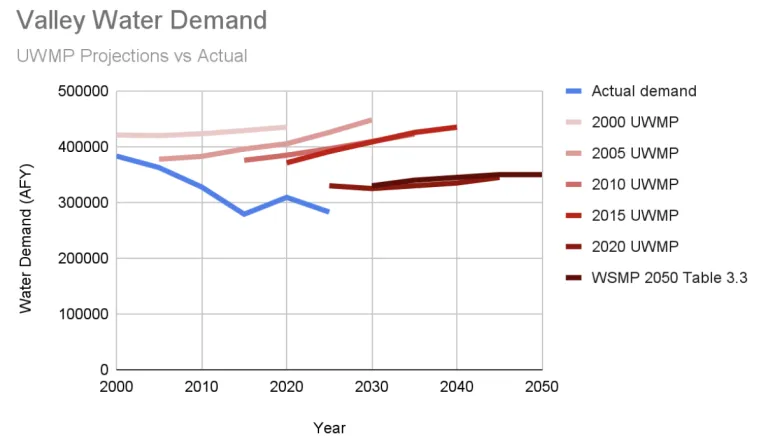
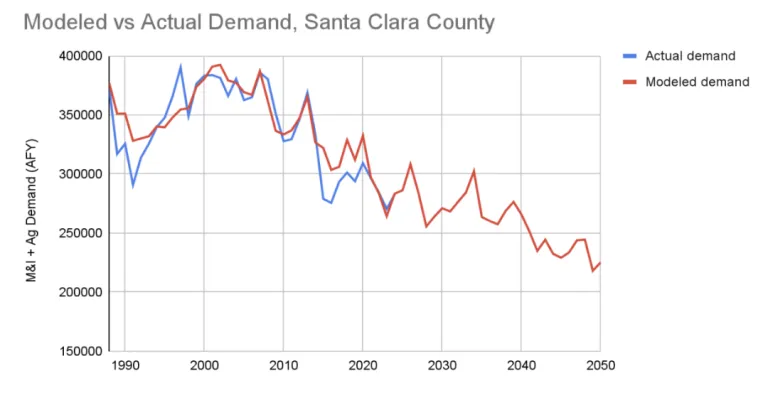
Valley Water's UWMP demand projections have consistently overestimated future water demand.
More recently, Sierra Club conducted a similar analysis of Valley Water’s countywide demand projections for Santa Clara County. The chart below shows the history of Valley Water’s UWMP demand projections vs. actual use during the past 25 years.
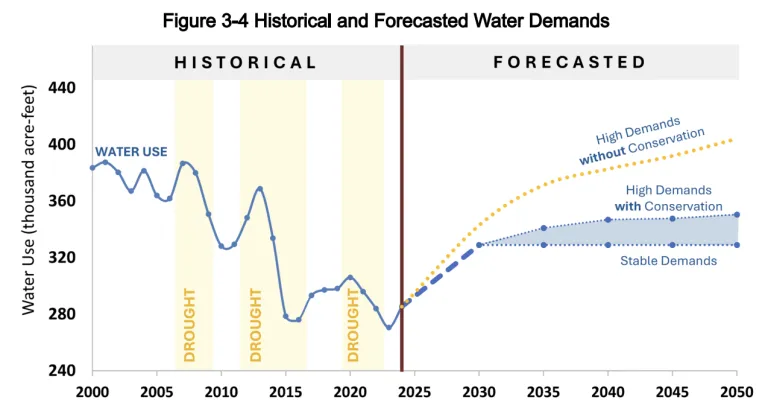
Furthermore, demand projections in the Water Supply Master Plan 2050 (WSMP), which Valley Water plans to use for the 2025 UWMP, do not appear to align with the projections from the model discussed in Appendix D of the WSMP. The drought rebound between now and 2030, the stable demand curve and the high demand with conservation curve all seem to be arbitrary and are not supported by the model. The UMWP should use model results for demand projections, not these arbitrary values.
The forecasted Santa Clara County water demands through 2050 (WSMP Table 3-3) show demand starting at 330,000 AFY in 2030 with conservation. This seems to be unreasonably high given current demand is less than 300,000 AFY and demand has not reached 330,000 AFY since 2014. WSMP Figure 3-4 (see chart below) illustrates this well, with the steep demand curve increase between now and 2030. The assumption that the drought rebound will continue does not appear to be supported by the model so should be updated in favor of using model outcomes for changes in demand.
The Drought-Demand Model: A statistical model based on the Standardized Evapotranspiration-Preciptitation Index (SPEI) drought index is a better predictor of water demand.
The standard water agency approach to modeling droughts is to assume that hotter, drier weather increases water use. This appears to be what the Valley Water model does in its climate modeling.
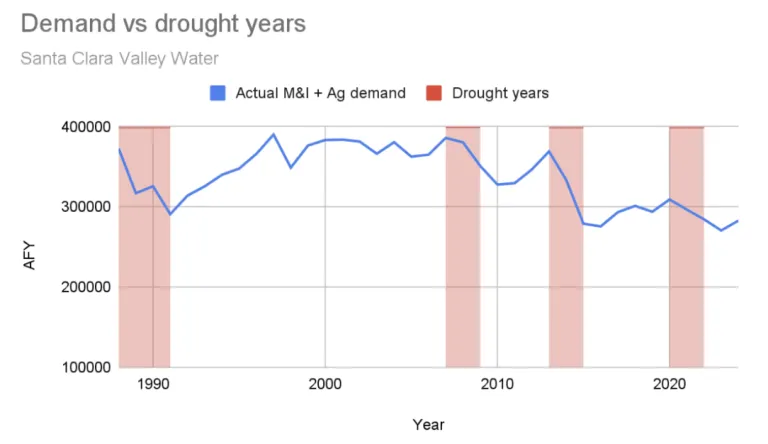
However, this approach is not supported by the historical record. In fact, droughts and higher temperatures over the past 20 years have suppressed water demand among Valley Water retailers. Every drought has resulted in large demand reductions, and post-drought demand has not rebounded to previous levels. Droughts have a long-term impact on demand by causing both behavioral changes (e.g. replacing lawns) and policy changes (e.g. the ban on watering ornamental turf with potable water). See figure below for a timeline of droughts and consumption in Santa Clara County.
Using this insight, the Sierra Club built a curve-fitting model. This Drought-Demand Model uses a common drought measure to predict future water use. This drought measure, the Standardized Precipitation and Evapotranspiration Index (SPEI), coupled with population data and historical water use from the year 1976 to today, shows high predictive value when tested against out-of-sample test data. Essentially we created a water use curve that responds to a drought index and then tested it against years that we held back from the model. Our Drought-Demand Model’s in-sample Mean Absolute Percentage Error (MAPE) is 3.4% and out-of-sample MAPE is 8.7%. In other words, our Drought-Demand Model has a 8.7% forecast error, compared to the 50% historical forecast error of Valley Water’s WSMP projections.
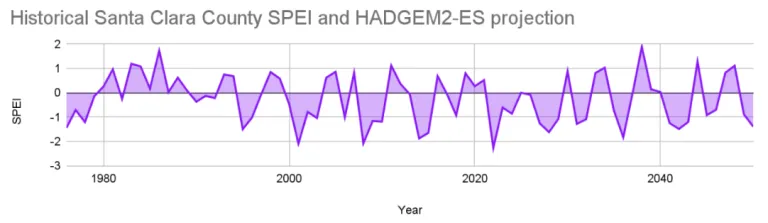
The key to our model is the assumptions around future droughts. We pulled drought (SPEI) predictions for Santa Clara County from the world’s leading climate models, and settled on the HadGEM2-ES365 (Historical +rcp45) as our baseline model. This model is used by CalAdapt to test against future droughts and runs slightly warmer and drier than other models. For our population inputs, we used the California Department of Finance population projections for Santa Clara County, which project 0.11% annual population growth to 2050. Below is a chart that shows the future drought projection we used for a baseline. Negative numbers are drier and/or hotter than normal and positive numbers are wetter and/or cooler than normal.
The Drought-Demand Model shows continuing reductions for the next 20 years. We find in our base case that 2050 Santa Clara County demand for potable water could be about 225,000 acre-feet per year (AFY) in 2050. In this case, the 350,000 AFY predicted by the WSMP 2050 “High Demand with Conservation” projection could be a 55% overestimate.
We believe the Drought-Demand Model uses reasonable alternative assumptions that should be considered and tracked to avoid over-investment, leading to increased unit-costs and increased water rates, thus resulting in additional conservation, etc.
A word about population projections: Valley Water uses relatively aggressive population growth numbers based on projections of the Association of Bay Area Governments. The growth rate chosen by Valley Water for its projections has not been attained for the past 25 years and far exceeds historical population growth rates. The Department of Finance projections we use have generally been accurate within 3% on a 10-year basis, with errors tending toward overestimation of growth.
Conclusion
We ask that Valley Water's 2025 UWMP consider our Drought-Demand Model demand projections for Santa Clara County, and inform retailers in the County about this alternative for consideration in their UWMPs.
The potential for reduced demand provides an opportunity to further reduce reliance on the Sacramento/San Joaquin Delta and return much-needed flows to the ecosystem as mandated by the Delta Reform Act. This is also in line with Valley Water’s 2026 Legislative Guiding Principles which support “efforts to address all Delta stressors, including ... in-Delta and upstream diversions.”
In particular, the Sierra Club is concerned about Valley Water’s participation in mega-projects such as Sites Reservoir and the Delta Conveyance Project. In addition to the great environmental harm these projects will have on the Delta, these projects will have ever-rising costs resulting in unplanned water rate increases and impacts on water affordability. Decreasing demand would also result in increased water rates per unit. These rate increases would likely encourage further demand reduction. Although we did not analyze affordability for Valley Water ratepayers as part of these comments, the potential impacts of decreasing demand on affordability should be analyzed and understood.
In summary, utilizing more realistic demand projections improves planning, reduces the need for rate increases, reduces the need to invest in water supply projects, and helps to address affordability.
Thank you for considering our input and making sure the 2025 UWMP includes modeling scenarios that capture the potential for continued reduction in demand. We would welcome the opportunity to meet with staff to discuss our Drought-Demand Model and the importance of these alternative demand projections in the context of the UWMP.
Sincerely,
Sue Chow, Chapter Chair
Sierra Club Loma Prieta Chapter
Miguel Miguel, Director
Sierra Club California