
December 4, 2025
To: Policy Committee Chair Karen Hardy <khardy@santaclaraca.gov>
cc: BAWSCA Board of Directors <bawscaboardofdirectors@bawsca.org>; bawsca@bawsca.org
Subject: DSS water demand model – comments for December 10 Board Policy Committee meeting
Dear Chair Hardy and BAWSCA Board Members,
Thank you for this opportunity to comment to the Policy Committee on BAWSCA’s water demand model (the Decision Support System, or DSS). While much work by experienced industry professionals has gone into developing the DSS model, we strongly believe that past performance data needs to be recognized and included in the model. The current DSS ignores BAWSCA members’ track record of conservation. We believe a more nuanced, evidence-based view of demand will allow better management of the Tuolumne River and its ecosystem—as well as preserve water affordability for ratepayers. This memo outlines our concerns and presents opportunities for collaboration.
1. BAWSCA’s DSS models have consistently overestimated future water demand
BAWSCA has for decades put thought and energy into helping its members model demand for drinking water.
However, the projections have historically been very inaccurate, overestimating water demand by more than 50% on a 15-year horizon when examined retrospectively. This overprojection has not improved over time – the 2022 DSS projection overestimated the 2025 water use by 15%. This graphic below illustrates the trend.
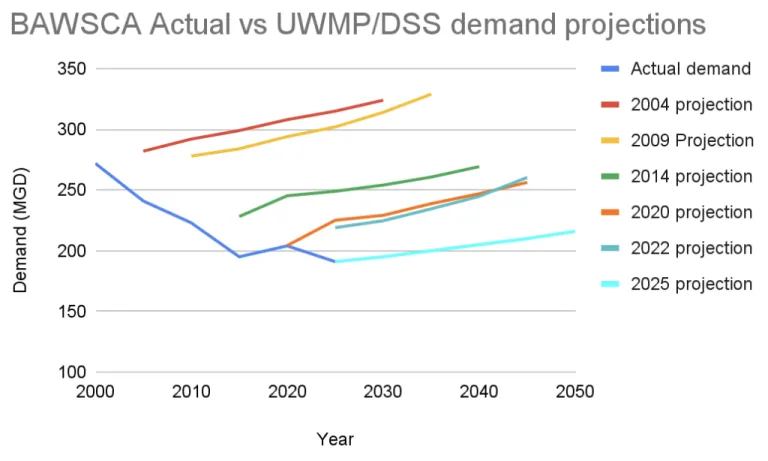
The current (2025) DSS appears to suffer from the same issue, projecting ever-increasing demand despite long-term historical trends of ever-decreasing demand. Without access to the model inputs, it is hard to understand what is driving this result. However, in our brief conversation with the consulting team building the model, it appears that they are assuming in their model that the coefficients they derive from past correlations carry on into the future unchanged. These coefficients govern, for example, calculations of water use per measure of economic activity or water use per multifamily unit. They also appear to be incorrectly interpreting what happens to water use in a hotter, drier future climate. Finally, they have not yet taken droughts into account, and our understanding of their previous work around droughts is that it has not substantially changed the outcome of the modeling.
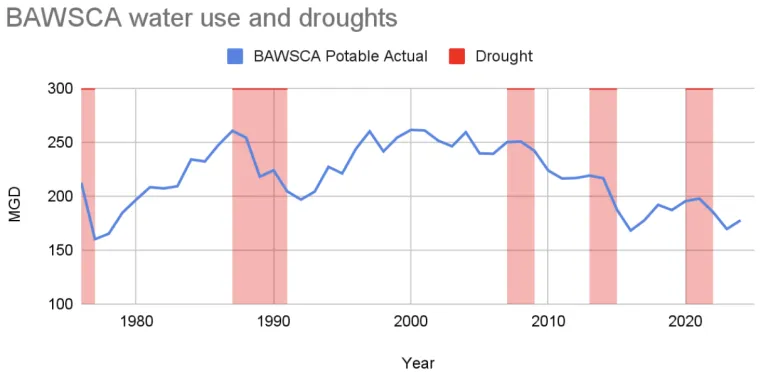
2. The Drought-Demand Model: A statistical model based on the SPEI drought index is an extremely good predictor of water demand.
The standard water agency approach to modeling droughts is to assume that hotter, drier weather increases water use. This is what the DSS model does in its climate modeling.
However, this approach is not supported by the historical record. In fact, droughts and a hotter, drier climate in the past 20 years have actually served to suppress water demand among BAWSCA members. Every drought has resulted in large demand reductions, and post-drought demand has not rebounded to previous levels. Droughts have a long-term impact on demand by causing both behavioral changes (e.g. replacing lawns) and policy changes (e.g. the ban on watering ornamental turf with potable water). See figure below for a timeline of droughts and consumption:
Using this insight, we have built a curve-fitting model. This Drought-Demand Model uses a common drought measure to predict future water use. This drought measure, the Standardized Precipitation and Evapotranspiration Index (SPEI), coupled with population data and historical water use from the year 1976 to today, shows extremely high predictive value when tested against out-of-sample test data. Essentially we created a water use curve that responds to a drought index and then tests it against years that we held back from the model. Our Drought-Demand Model’s in-sample Mean Absolute Percentage Error (MAPE) is 4% and out-of-sample MAPE is 4.5%. In other words, our Drought-Demand Model has a 4.5% forecast error, compared to the 50% historical forecast error of the DSS. This is not to denigrate the DSS model, but to show that our results are well within the bounds of what has been considered accurate in the past. We are available to discuss our model in detail.
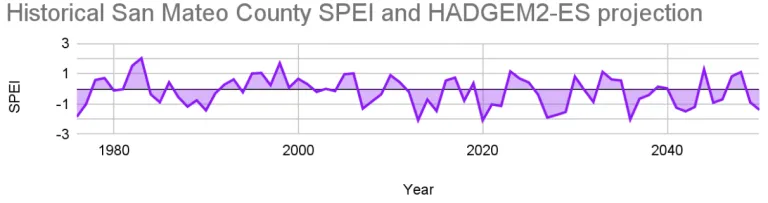
The key to our model, of course, is the assumptions around future droughts. We pulled drought (SPEI) predictions for San Mateo County from the world’s leading climate models, and settled on the HadGEM2-ES365 (Historical +rcp45) as our baseline model. This model is used by CalAdapt to test against future droughts and runs slightly warmer and drier than other models. For our population inputs, we used the California Department of Finance population projections for San Mateo County, which project 0.12% annual population growth to 2050. Below is a chart that shows the future drought projection we used for a baseline. Negative numbers are drier and/or hotter than normal and positive numbers are wetter and/or cooler than normal.
3. The Drought-Demand Model shows a decline in water demand of about 30 MGD over the next 25 years, indicating the DSS model is overestimating demand by about 50%
The chart below shows the results of our baseline Drought-Demand Model. The dark blue line is historical potable water use, the red line is Drought-Demand modeled historical and future use, the light blue line is the BAWSCA DSS model baseline results.
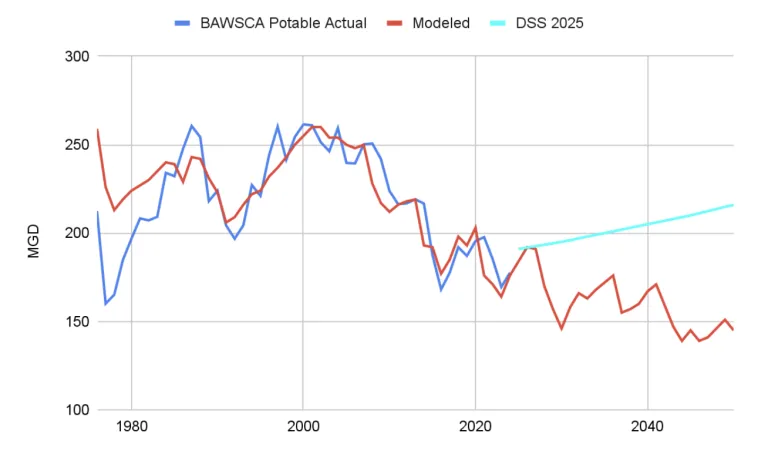
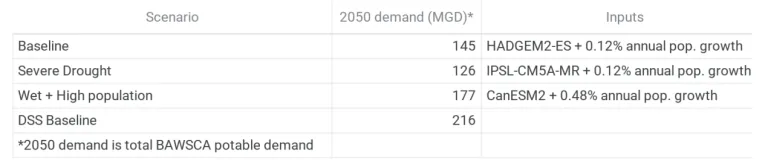
We find in our base case that 2050 BAWSCA demand for potable water will be about 145 MGD. This indicates the 216 MGD predicted by the baseline DSS is a roughly 50% overestimate.
Various scenarios we ran show a range of 2050 potable demand from 126 MGD in an extreme drought scenario (using the very hot/dry model IPSL-CM5A-MR (Historical +rcp45)) to 177 MGD (flat from today), using both the somewhat wetter CanESM2 (Historical +rcp45) and a population growth rate 4x higher than the DOF numbers. The table below lays out these scenarios:
4. The consequences for the environment of over-estimation are severe
The over-estimation of demand leads to a posture toward managing riverine ecosystems that is, to put it mildly, bad for riverine ecosystems. It’s an approach focused on the control of nature rather than adaptation.
The lynchpin of environmental sustainability in the Tuolumne River ecosystem – the ecosystem that supplies BAWSCA members with most of their water – is the Bay Delta Plan. The Bay Delta Plan assures enough water for continued recovery of salmon and other species and for improved health of the ecosystem. As the State Water Resources Board stated, “Fish habitat quantity and quality on the Tuolumne River is primarily controlled by flows.”
The DSS’s overprojections put BAWSCA on a wholly unnecessary path opposing the Bay Delta Plan. Instead of seizing the future of declining demand, BAWSCA and its members have used the DSS as justification to argue that the Bay Delta Plan would deprive their customers of the water they need.
Indeed, in Tom Smegal’s letter to the State Water Resources Control Board, dated November 7, 2025, about the Scientific Basis Report on the Bay Delta Plan, Mr. Smegal cited the Urban Water Management Plan (UWMP) projections as the reason he was concerned about water availability during a drought. He wrote this despite knowing that the most recent DSS model that underlies the UWMPs had overprojected 2025 water use by 18% just five years into the future.
Projected future high demands will always point to the necessity of more supply. The SFPUC’s Alternative Water Supply (AWS) plan is an example of this. Supply now comes in the form of expanded reservoirs that destroy terrestrial ecosystems or water purification schemes that explode the greenhouse gas budgets and wallets of our communities. It’s a choice to spend billions of dollars pouring concrete. We urge you to choose a different and more reasonable path, supported by historical data.
The Bay Delta Plan is a stand-in for the proposition that people and ecosystems can co-exist, and for the idea that people do not have to remove every drop of life from an ecosystem. It’s a stand-in for the environmental values that Californians hold at their core. Each and every year of this unnecessary battle means poorer ecosystems and poorer people.
5. The affordability consequences for BAWSCA ratepayers are likely to also be severe
BAWSCA’s ratepayers are likely to pay more for their water during the next 25 years as a result of BAWSCA’s overly high demand projections.
First, the high demand projections encourage capital spending. For example, the new, nearly half-billion dollar headquarters building being built by the SFPUC (the Millbrae Campus) is something for which BAWSCA ratepayers will have to pay their proportional share. This new water temple is a symbol of agency bloat justified by BAWSCA’s ever-increasing demand and revenue projections over the years.
The high demand projections have also led the SFPUC to put forward various capital projects to increase supply under the Alternative Water Supply (AWS) plan. These AWS projects, if they go forward, will raise both the capital and operational costs BAWSCA members will pay for wholesale water over the next 25 years.
Second, high demand projections lead to misleadingly low cost projections. Our chart below compares the SFPUC’s current wholesale water cost projections, based on demand numbers from BAWSCA. Our modeling indicates that wholesale rates will increase 135% over the next 20 years because fixed infrastructure costs will have to be spread over fewer gallons sold.
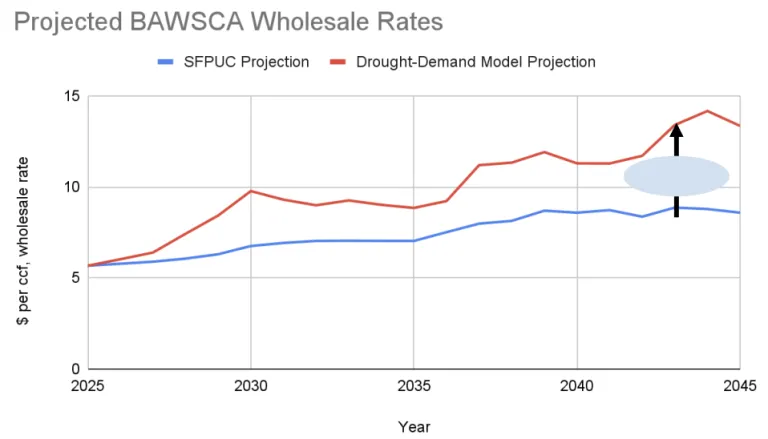
This rapid acceleration in rates, especially over the next five years, will be difficult for BAWSCA customers to absorb. Less wealthy customers, especially, will struggle to pay for low-flow plumbing, leak fixes and drought-resistant landscaping. Wealthier homeowners and businesses will be able to adapt, but will be upset to see the annual increases in their water rates.
Overestimating demand has significant financial consequences particularly in the SFPUC’s situation: Wholesale water rates are already high (doubling since 2015), its Regional Water System (RWS) is a fixed cost system (costs don’t vary with volume), and the SFPUC is heavily laden with debt it took on to fund its capital projects (such that roughly 50% of wholesale water rates go to servicing debt).
Should demand not materialize as forecasted, the SFPUC has no choice but to increase rates above what was projected. It has little ability to reduce costs to adapt to a lower demand scenario. In addition, higher water rates cause further reductions in demand, which has contributed to the decline in per capita demand that’s been experienced during the past 20 years.
BAWSCA agencies have already experienced unplanned rate increases. In May 2022 the SFPUC projected the FY 2026 wholesale rate to by $5.25/ccf. Today that rate is $5.80, 10% higher than projected. The unplanned increase is in part due to demand not growing as forecasted and in part due to a large increase in capital spending.
Based on current demand projections and due to high median household incomes in most cities served by BAWSCA, most cities’ combined water and sewer bills appear unlikely to exceed local affordability thresholds for a decade or more. However if California’s median household income were used as the basis for calculating affordability, almost all BAWSCA member cities would see their combined water and sewer bills already exceeding affordability thresholds. This bodes poorly for cities trying to attract a mix of residents, including teachers, firefighters and other public servants.
Local agencies have little ability to absorb the cost of unexpected SFPUC rate increases. Cities are already facing their own financial challenges both from the need to upgrade aging infrastructure and recent court cases that point to reducing or eliminating water rate billing tiers due to Proposition 218. The elimination of these tiers typically increases rates further for lower-volume, and, usually, lower-income water users.
The San Diego County Water Authority is a good example of an agency that has experienced some of these issues. San Diego’s struggles include a deteriorating financial condition and large rate increases after a large capital program designed to address demand that never materialized.
Utilizing more realistic demand projections improves planning, reduces the need for unplanned rate increases, reduces the need for alternative water supplies and helps with addressing affordability thresholds.
6. Summary and proposed actions
In summary, BAWSCA staff and members have set themselves up for a choice: They can acknowledge the members’ track record of winning on water use efficiency – and couple that with sensitive habitat management – or they can continue to overpredict demand, and the environment and ratepayers will suffer for it.
We suggest concrete actions to move the discussion forward:
- Create a working group with BAWSCA staff, interested members’ representatives, the
Hazen consulting team and outside stakeholders to work to reconcile the various
projections of demand. The previous stakeholder group was somewhat unsatisfactory
and did not substantially change the baseline scenario. This new group should operate
on the principle of full data and model transparency. - Set a January board agenda item to reassess demand projections ahead of the UWMP
process. - Budget for work with outside stakeholders in 2026 to alter BAWSCA’s approach to the
Bay Delta Plan
Katja Irvin, Guadalupe Group Conservation Chair
Sierra Club Loma Prieta Chapter
John J. Bauters, Chair
San Francisco Bay Chapter
Miguel Miguel, Director
Sierra Club California
Attachment: Letter from Tom Smegal to SWRCB, dated November 7, 2025