
February 19, 2026
To: SFPUC Commissioners Joshua Arce, Stephen Leveroni, Avni Jamdar, Kate Stacy, Meghan Thurlow
cc: Mayor Daniel Lurie, Members of the San Francisco Board of Supervisors, Alicia John-Baptiste, Dennis Herrera, Steve Ritchie, Doug Jacuzzi
Subject: SFPUC water demand projections are unrealistically high and threaten Tuolumne River ecosystem and ratepayer affordability
Dear Commissioners,
The Sierra Club, representing 5,500 members in San Francisco and 35,000 around the Bay Area, has concerns about the SFPUC’s water demand projections. The draft 2025 Urban Water Management Plan (UWMP) demand projections paint an unrealistically high picture of future water demand. The projections ignore the clear track record of conservation in SFPUC’s wholesale and retail service territory.
The projections create an unaffordable future—one that, in some respects, is already here. Inflated demand projections justify expensive capital projects and large budgets. When that demand fails to materialize, these increased costs must then be spread over lower volumes sold, driving up rates. Indeed, the SFPUC has proposed raising its wholesale water rates for the next two years 7% per year—up from the previously proposed 1%. This hike will affect customers in San Francisco in the same way it will affect suburban wholesale customers.
In addition, the SFPUC is using these same demand projections to argue vociferously against the Bay Delta Plan, starving the Tuolumne River ecosystem of the water it needs for fish and wildlife populations to recover from the declines suffered partly because of the SFPUC’s operations of its Hetch Hetchy system. We are in the welcome position where the interests of protecting the environment and lowering costs for ratepayers align.
This memo outlines our concerns and presents opportunities for collaboration.
SFPUC’s demand projections have consistently overestimated future water demand
The SFPUC has, for decades, modeled water demand for its wholesale and retail customers, partly to meet regulatory requirements for UWMPs and partly for its own planning purposes.
However, the projections have historically been very inaccurate, overestimating water demand by 45 to 50% on a 15-year horizon when examined retrospectively. This overprojection has barely improved over time—the 2020 UWMP projection overestimated 2025 water use by 13% just four years after its issuance in 2021. The graphic below illustrates the trend.
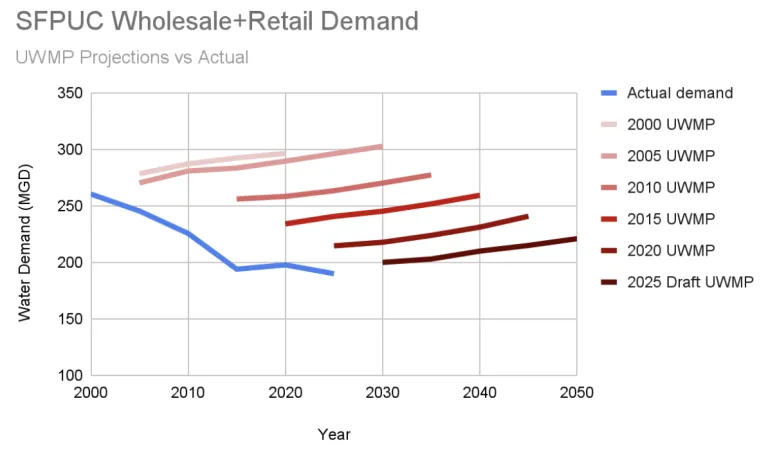
The draft 2025 UWMP demand projections we have reviewed from the SFPUC appear to suffer from the same issue, projecting ever-increasing demand despite long-term historical trends of decreasing demand.
Because the overprojections are so consistent, we are concerned that the problem is not a technical one, but one of orientation on the part of the SFPUC and BAWSCA. The SFPUC appears to have a general posture of overprojecting needs—its 8.5 year design drought is by some accounts 2.5 years longer, 72% more severe and 19 times less likely than the six year design drought used by peer agencies EBMUD and Valley Water. At the same time, it has underweighted the 30% demand reduction San Franciscans have worked so hard to achieve over the past 25 years. In fact, SFPUC leadership has stated that they view UWMP demand projections as asking the question of “how much water would you need to accommodate what the [San Francisco Planning Department] planning projects” and that the UWMP projections represent the “outside of the envelope” projections.
That SFPUC’s demand projection posture does not appear in line with guidance from the California Department of Water Resources, which states in its guidebook on UWMP demand projections:
A thorough characterization and analysis should provide a realistic prediction of future water use based upon a Supplier’s past and current water use, combined with considerations of anticipated growth, new regulations, changing climate conditions, and trends in customer water use behaviors. [Emphasis added.]
The SFPUC takes BAWSCA’s projections and incorporates them into its own projections. Since the BAWSCA agencies represent two-thirds of Regional Water System (RWS) demand, and the SFPUC uses the BAWSCA numbers in its UWMP, there is a tension present: The utility owned by San Franciscans—the SFPUC—ends up paying for additional infrastructure and in so doing causing additional harm to the environment because it has incorporated overprojected demand numbers from a source it does not control.
Without access to the model inputs, it is hard to understand what, as a technical matter, is driving the overprojections. In our brief conversation with the consulting team building the BAWSCA model, it appears that they are assuming in their model that many of the coefficients they derive from past correlations carry on into the future unchanged. These coefficients govern, for example, calculations of water use per measure of economic activity or baseline water use per multi-family unit. They also appear to be incorrectly interpreting what happens to water use in a hotter, drier future climate. For example, they have not yet taken droughts into account, and our understanding of their previous work around droughts is that it has not substantially changed the outcome of their modeling.
The Drought-Demand Model: A statistical model based on the Standardized Evapotranspiration-Precipitation Index (SPEI) drought index is a better predictor of water demand.
The standard water agency approach to modeling droughts is to assume that hotter, drier weather increases water use. This is what BAWSCA and the SFPUC appear to do in their climate modeling.
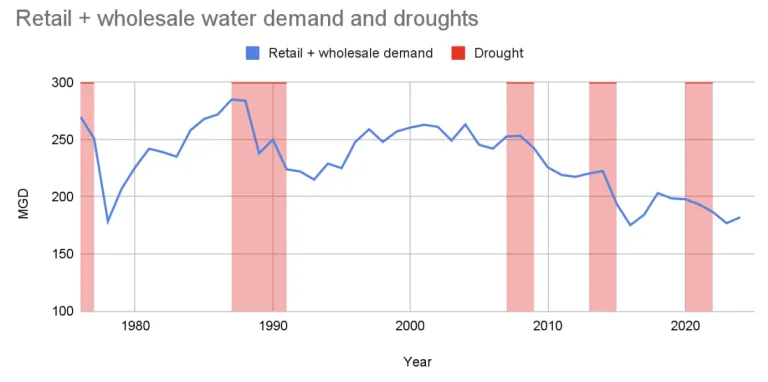
However, this approach is not supported by the historical record. In fact, the behavioral and policy changes due to droughts and a hotter, drier climate in the past 20 years have actually served to suppress water demand among the SFPUC’s customers. Every drought has resulted in large demand reductions, and post-drought demand has not rebounded to previous levels. Droughts have a long-term impact on demand by causing both behavioral changes (e.g. replacing lawns) and policy changes (e.g. the ban on watering ornamental turf with potable water). See figure below for a timeline of droughts and consumption.
Using this insight, we have built a curve-fitting model.This Drought-Demand Model uses a common drought measure to predict future water use. This drought measure, the Standardized Precipitation and Evapotranspiration Index (SPEI), coupled with population data and historical water use from the year 1976 to 2024, shows high predictive value when tested against out-of-sample test data. Essentially, we created a water-use curve that responds to a drought index and then tests it against the years 2015 to 2024 that we withheld from model calibration. The model’s in-sample Mean Absolute Percentage Error (MAPE) is 4.0%, and its out-of-sample MAPE is 4.3%. In other words, our Drought-Demand Model has an expected 4.3% forecast error, compared to the 45-50% historical forecast error of the SFPUC’s projections. This comparison is not intended to denigrate the SFPUC’s work, but to show that our results are well within–and substantially better than–the range historically considered accurate. We are available to discuss our model in detail.
To make clear an important technical distinction around correlation vs causation: Although the drought index is highly correlated with these changes in behavior and demand and gives a tight curve fit, the index itself does not cause changes. In other words, certain policies and behaviors promoting conservation tend to result from droughts, but droughts and the drought index do not cause a change in demand on their own.
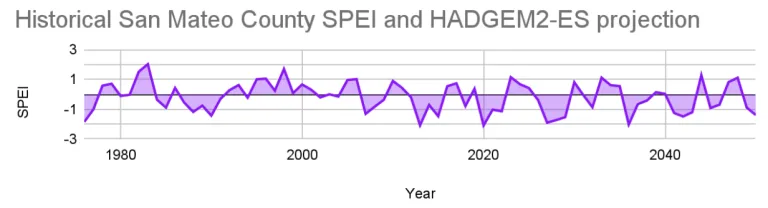
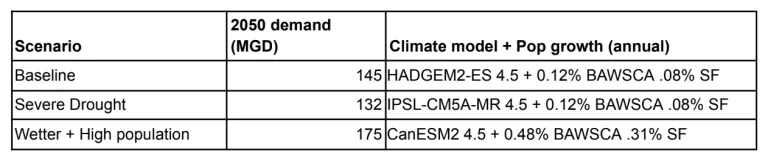
The key to our model, of course, is the assumptions around future droughts. We pulled drought (SPEI) predictions for San Mateo County from the world’s leading climate models, and settled on the HadGEM2-ES365 (Historical +rcp45) as our baseline model. This model is used by CalAdapt to test against future droughts and runs slightly warmer and drier than other models. For our population inputs, we used the California Department of Finance population projections for San Francisco and San Mateo County, which project 0.08% and 0.12% annual population growth to 2050, respectively. Below is a chart that shows the SPEI historical and future drought projection we used for a baseline. Negative numbers are drier and/or hotter than normal and positive numbers are wetter and/or cooler than normal.
The Drought-Demand Model shows a decline in water demand of about 45 MGD over the next 25 years, indicating the SFPUC projections are overestimating demand by about 50% over the next 25 years
The chart below shows the results of our baseline Drought-Demand Model.
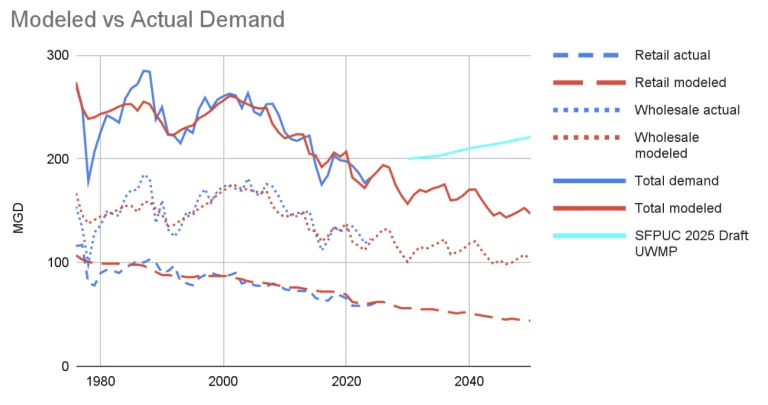
The blue lines are historical water use, including retail, wholesale and total.1 The red lines are the Drought-Demand modeled historical and future use.
We find in our base case that 2050 retail + wholesale demand for potable water will be about 147 MGD. This indicates the 221 MGD predicted by the BAWSCA and SFPUC projections is a roughly 50% increase from our drought-driven projection.
Various scenarios we ran show a range of 2050 potable and recycled demand from 132 MGD in an extreme drought scenario using the very hot/dry model IPSL-CM5A-MR (Historical +rcp45), to 175 MGD (slightly down from today) using both the somewhat wetter CanESM2 (Historical +rcp45) and a population growth rate 4x higher than the DOF numbers. The table below shows these scenarios.
A word about population projections: both BAWSCA and the SFPUC use relatively aggressive population growth numbers based on projections of planning departments or the Association of Bay Area Governments. For example, the growth rate chosen by BAWSCA for its projections has not been attained on a decade-long basis for the past 30 years. The rate the SFPUC chooses for its retail customers is similarly high and far exceeds historical population growth rates. The Department of Finance projections we use have generally been accurate within 3% on a 10-year basis, with errors tending toward overestimation of growth. That said, even if we use population growth rates four times higher than those projected by DOF along with our baseline HADGEM2-ES climate scenario, we project 2050 demand at 160 MGD.
The consequences for the environment of over-estimation are severe
The over-estimation of demand leads to an approach toward managing riverine ecosystems that is, to put it mildly, bad for riverine ecosystems. It’s an approach focused on the control of nature rather than adaptation.
The linchpin of environmental sustainability in the Tuolumne River ecosystem—the ecosystem that supplies SFPUC customers with most of their water—is the Bay Delta Plan. The Bay Delta Plan assures enough water for continued recovery of salmon and other species and for improved health of the ecosystem. As the State Water Resources Board stated, “Fish habitat quantity and quality on the Tuolumne River is primarily controlled by flows.”
Historical overprojections put the SFPUC and BAWSCA on a wholly unnecessary path opposing the Bay Delta Plan. Instead of seizing the future of declining demand, the SFPUC, BAWSCA and BAWSCA’s members have used ever-increasing demand projections to argue that the Bay Delta Plan would deprive their customers of the water they need.
The SFPUC has said that the Bay Delta Plan would result in a water supply shortfall of between 92 and 122 MGD. However, both the California State Water Resources Conservation Board and the Yosemite Rivers Alliance have found significantly smaller shortfalls in their modeling. The Yosemite Rivers Alliance has found that if the Bay Delta Plan were implemented, the SFPUC would not need any make-up water supplies nor would it need any rationing to navigate the six year drought of record that other peer agencies use to test for resiliency. Future drops in demand would only enhance the case for working within the constraints of the Bay Delta Plan.
Indeed, in BAWSCA Executive Director Tom Smegal’s November 7, 2025 letter to the State Water Resources Control Board about the Scientific Basis Report on the Bay Delta Plan, Mr. Smegal cited the UWMP projections as the reason he was concerned about water availability during a drought. He wrote this despite knowing that the 2020 BAWSCA demand model had overprojected 2025 water use by 18% just five years into the future.
The Bay Delta Plan is a stand-in for the proposition that people and ecosystems can co-exist, and for the idea that people do not have to remove every drop of life from an ecosystem. It’s a stand-in for the environmental values that Californians hold at their core. Each and every year of this unnecessary battle means poorer ecosystems and poorer people.
Inevitably, SFPUC staff members point to the supposed issue of “demand hardening” as a reason they will find future reductions in demand difficult to achieve. This is a red herring that has been dangled by the SFPUC for decades. It has not proven correct. For example, in 2007, the SFPUC stated that “demand hardening is real.” Since then, the SFPUC’s retail and wholesale water use has dropped 27%. When presented with the incentives and policies that come out of droughts, water users have always saved water, and we expect that trend to continue for as long as California has droughts.
Overprojections of demand leads to overprojections of supply needs. The SFPUC’s Alternative Water Supply (AWS) Plan is an example of this. New supply comes in the form of expanded reservoirs that destroy terrestrial ecosystems or water-purification schemes that explode the greenhouse gas budgets and wallets of our communities. It’s a choice to spend billions of dollars pouring concrete. We urge you to choose a different and more reasonable path, supported by historical data.
The affordability consequences for SFPUC ratepayers are likely also to be severe
The SFPUC’s ratepayers are likely to pay more for their water during the next 25 years as a result of the SFPUC’s overly high demand projections.
First, the high demand projections encourage capital spending. For example, the SFPUC—at the same time as it is fighting the Bay Delta Plan as “enormously expensive”—is totally comfortable building two expensive new buildings: a nearly half-billion dollar RWS campus (the Millbrae Yard) and a nearly $400 million dollar SFPUC Water Division Campus at 2000 Marin in San Francisco. These modern-day water temples are a symbol of agency spending encouraged and justified by the SFPUC’s overprojections of demand and revenue.
The high demand projections have also led the SFPUC to put forward various capital projects to increase supply under the AWS Plan. These projects, if they go forward, will raise both the capital and operational costs BAWSCA members and SFPUC customers will pay over the next 25 years.
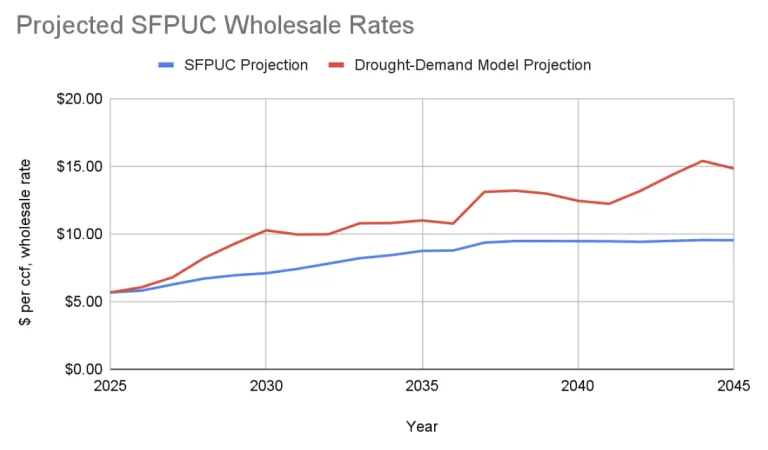
Second, high demand projections lead to misleadingly low rate projections. Our chart below compares the SFPUC’s current wholesale water cost projections with a future of declining demand. Our modeling indicates that wholesale rates will increase 160% over the next 20 years because fixed infrastructure costs will be spread over fewer gallons sold.
This rapid acceleration in rates, especially over the next five years, will be difficult for SFPUC customers to absorb. Less wealthy customers especially will struggle to pay for low-flow plumbing, leak fixes, and drought-resistant landscaping. Wealthier homeowners and businesses will be able to adapt but will be upset to see the annual increases in their water rates.
Overestimating demand has significant financial consequences, particularly in the SFPUC’s situation: wholesale water rates are already high (doubling since 2015), its RWS is a fixed-cost system (costs don’t vary with volume), and the SFPUC is heavily laden with debt it took on to fund its capital projects (such that roughly 50% of wholesale water rates go to servicing debt).
Should demand not materialize as forecasted, the SFPUC has no choice but to increase rates above what was projected. It has little ability to reduce costs to adapt to a lower demand scenario. In addition, higher water rates cause further reductions in demand, which has contributed to the decline in per capita demand experienced during the past 20 years.
We are seeing these shifts now: In May of 2025, the SFPUC projected the FY 2027 wholesale rate increase to be 1.0% and the FY 2028 increase to be 1.2%. In January 2026, the projected increases grew to 7.6% and 7.2% for FY 2027 and 2028 respectively. The unplanned increases are in part due to demand not growing as forecasted and in part due to a large increase in capital spending. The SFPUC is projecting rate increases for its retail water customers of more than 6.5% for the seven years starting in 2027. This means water rates will be at least 70% higher in eight years time. Lower costs and better environmental planning are one in the same in this case.
Based on the SFPUC’s own projections, combined water and sewer rates will become unaffordable for typical San Francisco households by a decade from now. This bodes poorly for a city trying to attract a mix of residents, including teachers, firefighters, and other public servants.
The San Diego County Water Authority is a good example of an agency that has experienced some of these issues. San Diego’s struggles include a deteriorating financial situation and large rate increases after a large capital program was implemented to address demand that never materialized.
Utilizing more realistic demand projections improves planning, reduces the need for rate increases, reduces the need for alternative water supplies, and helps to address affordability.
Summary and proposed actions
In summary, SFPUC staff and commissioners have set themselves up for a choice: they can acknowledge the SFPUC’s retail and wholesale customers’ track record of winning on water use efficiency—and couple that with more water flows for habitat management—or they can continue to overpredict demand, harming the environment and ratepayers.
We suggest concrete actions to move the discussion forward:
Create a working group with SFPUC staff and interested parties to work to build a realistic set of future demand scenarios to ensure future affordability and ecological integrity. This working group should be more than the two or three Zoom meetings that are normally part of the UWMP process, and the commissioners should vote on the working group recommendations. This new group should operate on the principle of full data and model transparency and should take various drought and climate scenarios into account. It should report to the SFPUC Board before UWMPs are issued. There should be one set of numbers used by the SFPUC, whether it’s the Financial Services Bureau or the Water Enterprise.
Set a board agenda item to reassess how supply and demand are conceived of in light of affordability and ecological concerns. San Francisco and San Franciscans have done a tremendous job over the past 25 years of increasing water efficiency. We expect that will continue. Instead of planning for all possible demand, the SFPUC should plan for a science-based demand target that allows for the ecological flows of the Bay Delta Plan and the vitality of our urban region. We trust our eco-conscious, city-owned utility and region can work diligently to achieve such a target. Staff and interested parties should both be invited to present at this meeting.
Budget for work with interested parties in 2026 to fully examine SFPUC’s approach to the Bay Delta Plan in light of changed demand projections.
Sincerely,
John J. Bauters, Chair
Sierra Club San Francisco Bay Chapter
Sue Chow, Chair
Sierra Club Loma Prieta Chapter
Miguel Miguel, Director
Sierra Club California
1 The SFPUC has slightly different figures for retail demand vs retail demand served by the RWS (i.e., not including recycled water or groundwater). For comprehensiveness and consistency here we endeavor to use total San Francisco retail and SFPUC-supplied wholesale demand numbers, as opposed to RWS-only demand numbers.